2022.DKE.Anomaly explanation: A review
- paper
- explanation by feature importance
- main idea
- Non-weighted feature importance(methods do not quantify the importance of each feature)
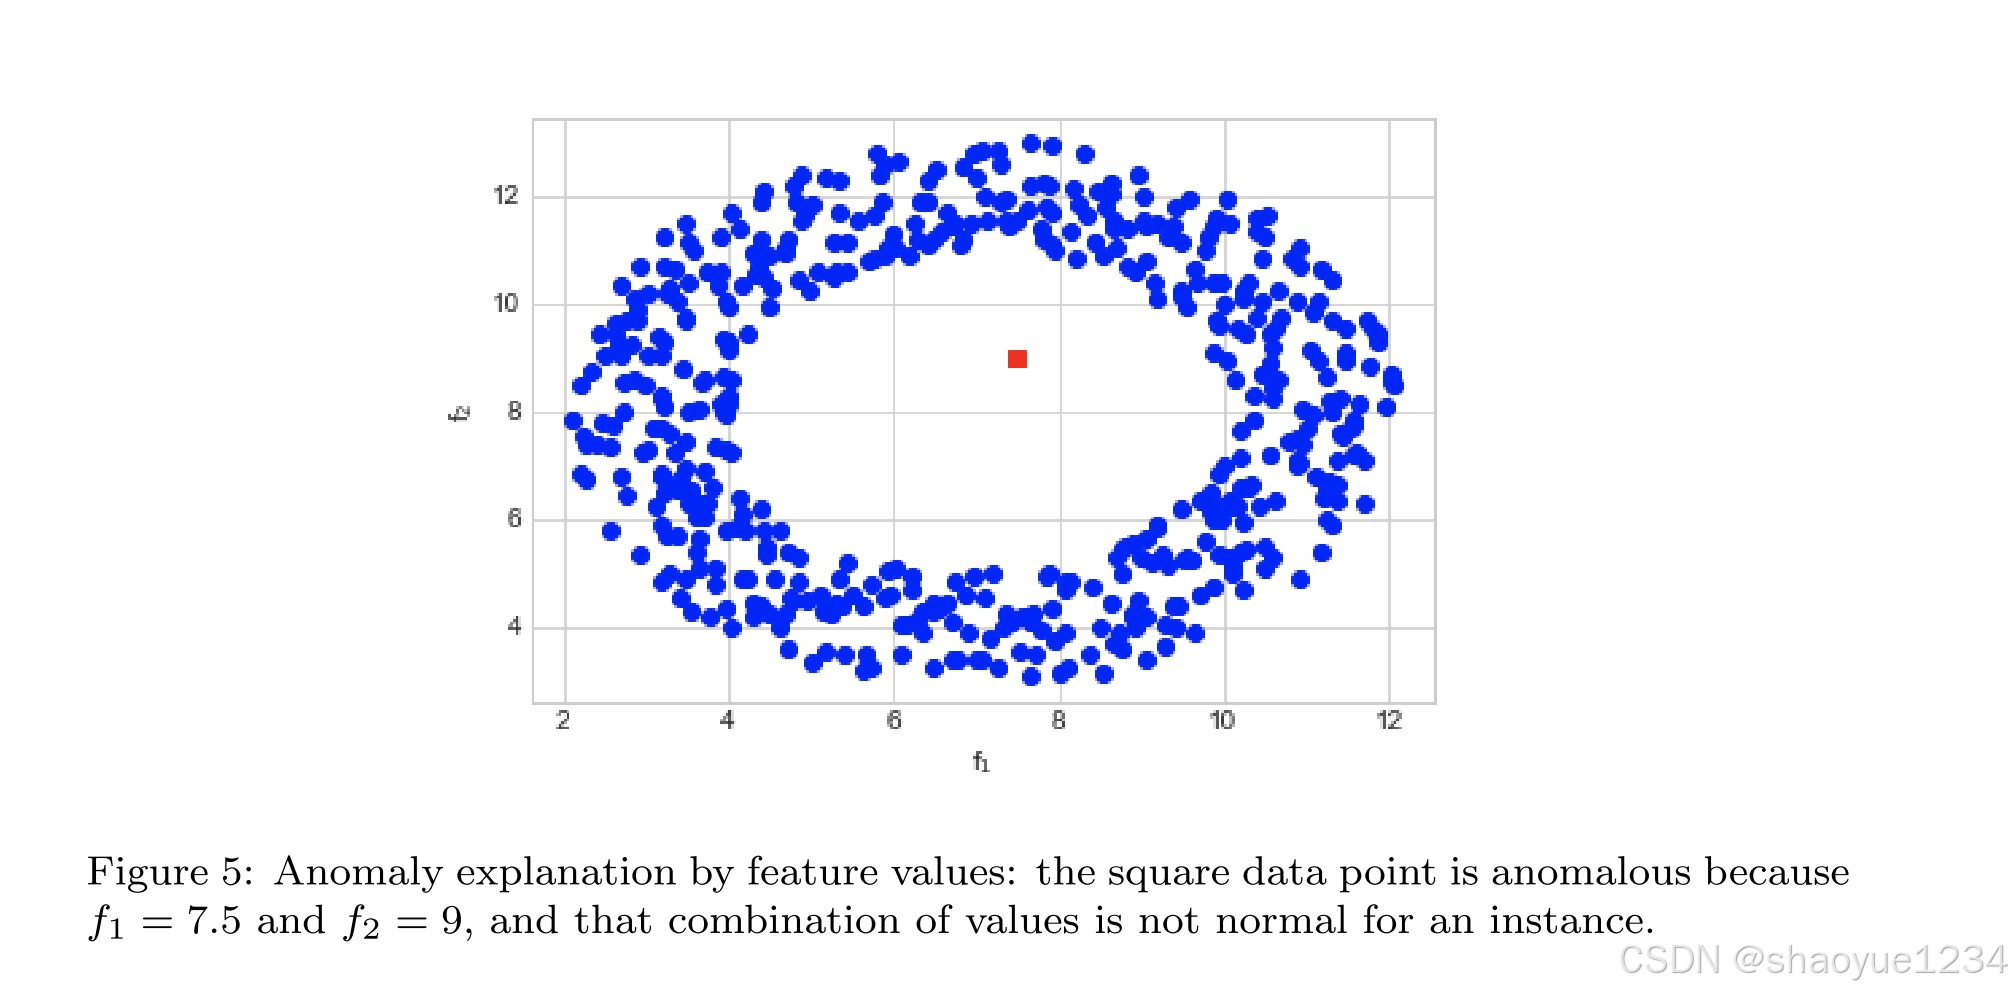
- explanation by feature values
- main idea
- explanation by data points comparison
- main idea
- explanation by structure analysis
- main idea
paper
explanation by feature importance
main idea
to explain that anomaly to the user, we can just say that attribute f1 contributed to the abnormality of the square data point.

Non-weighted feature importance(methods do not quantify the importance of each feature)
1999.VLDB.Finding intensional knowledge of distance-based outliers
- define the outlier categories C = {“trivial outlier,” “weak outlier,” “strongest outlier”} to help gain better insights about the nature of outliers.
2013.ICDM.Explaining outliers by subspace separability
- explain a given anomaly by identifying the subspace of features that best separates that outlier from the rest of the dataset.
2009.PAKDD.Outlier detection in axis-parallel subspaces of high dimensional data(SOD)
- identify outliers in subspaces of the original feature space
2012.ICDM.Outlier detection in arbitrarily oriented subspaces(COP)
- identify outliers in subspaces of a transformation of the original feature space
2019.ECML PKDD.Beyond outlier detection: lookout for pictorial explanation[pdf,code]
- use a set of focus-plots, each of which “blames” or “explains away” a subset of the input outliers.(for all the outliers)
2020.ICDM.LP-Explain: Local Pictorial Explanation for Outliers[pdf]
- identify the set of best Local Pictorial explanations (defined as the scatter plots in the 2-D space of the feature pairs) that can Explain the behavior for cluster of outliers.(different from lookout in for clusters of outliers)
2018.WACV.Anomaly explanation using metadata[pdf]
- use tags help to explain what causes the identified anomalies, and also to identify the truly unusual examples that defy such simple categorization
explanation by feature values
main idea
explanation by data points comparison
main idea
what is the difference between anomalies and regular data points.
explanation by structure analysis
main idea
x1 and x2 are anomalies for the cluster of round instances and why it is the case, that y is an anomaly for the the triangles and why, and finally that z is an anomaly
for the squares and why.
