使用了Plotly库来创建一个数据可视化图表,并使用滑块来控制显示哪些数据
import plotly.graph_objects as go
from plotly.subplots import make_subplots# 示例数据
x = [1, 2, 3, 4, 5]
y1 = [1, 2, 3, 4, 5]
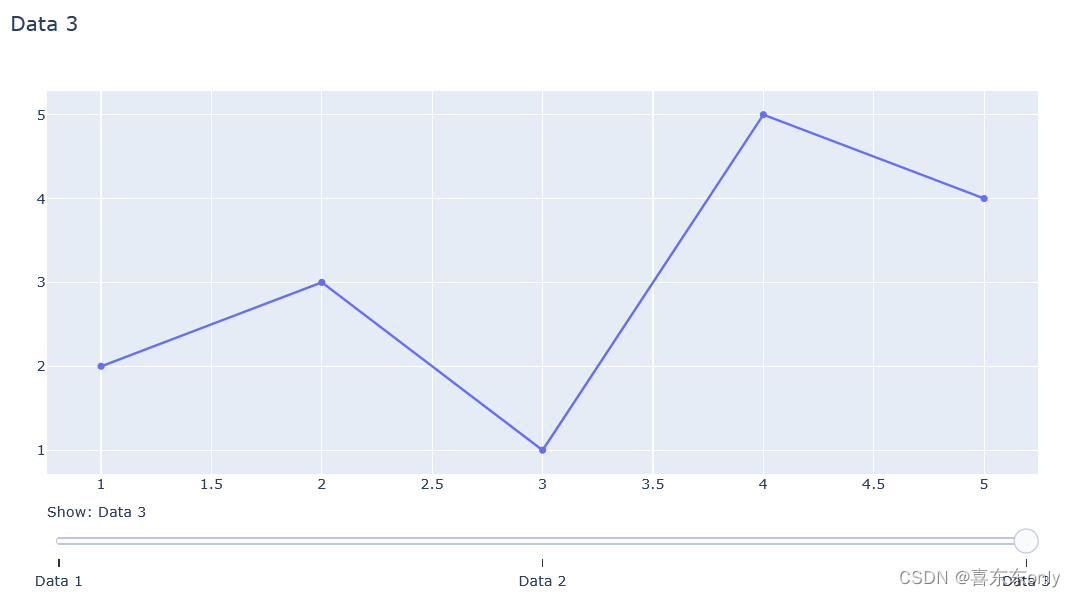
y2 = [5, 4, 3, 2, 1]
y3 = [2, 3, 1, 5, 4]# 创建子图
fig = make_subplots(rows=1, cols=1)# 添加初始数据
fig.add_trace(go.Scatter(x=x, y=y1, name="Data 1", visible=True),row=1, col=1
)
fig.add_trace(go.Scatter(x=x, y=y2, name="Data 2", visible=False),row=1, col=1
)
fig.add_trace(go.Scatter(x=x, y=y3, name="Data 3", visible=False),row=1, col=1
)# 创建滑块
steps = []
for i, y in enumerate([y1, y2, y3]):step = dict(method="update",args=[{"visible": [False] * 3}, {"title": "Data {}".format(i+1)}],label="Data {}".format(i+1))step["args"][0]["visible"] = [False] * 3step["args"][0]["visible"][i] = Truesteps.append(step)sliders = [dict(active=0,currentvalue={"prefix": "Show: "},steps=steps
)]# 更新布局
fig.update_layout(sliders=sliders,title="Data Visualization"
)# 显示图表
fig.show()