原文链接:使用梯度下降法实现多项式回归 - 柒墨轩 - 博客园
使用梯度下降法实现多项式回归
实验目的
本实验旨在通过梯度下降法实现多项式回归,探究不同阶数的多项式模型对同一组数据的拟合效果,并分析样本数量对模型拟合结果的影响。
实验材料与方法
数据准备
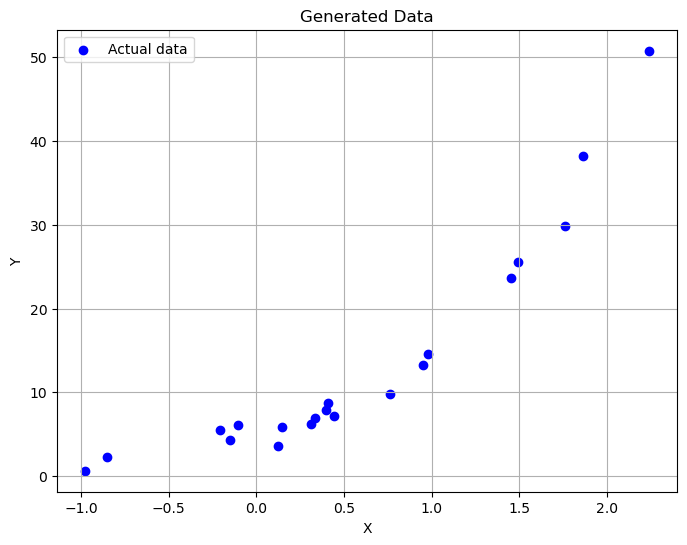
- 生成训练样本:我们首先生成了20个训练样本,其中自变量X服从均值为0,方差为1的标准正态分布。因变量Y由下述多项式关系加上均值为0,方差为1的误差项er构成: Y=5+4X+3X2+2X3+er
- 数据可视化:使用Matplotlib库绘制了生成的数据点。
代码
import numpy as np
import matplotlib.pyplot as plt# 设置随机种子以保证实验可重复性
np.random.seed(0)# 生成20个训练样本
n_samples = 20
X = np.random.normal(0, 1, n_samples)
e_r = np.random.normal(0, 1, n_samples)  # 误差项# 计算Y值
Y = 5 + 4 * X + 3 * X**2 + 2 * X**3 + e_r# 使用matplotlib显示生成的数据
plt.figure(figsize=(8, 6))
plt.scatter(X, Y, color='blue', label='Actual data')
plt.title('Generated Data')
plt.xlabel('X')
plt.ylabel('Y')
plt.legend()
plt.grid(True)
plt.show()
模型定义
- 定义多项式回归模型:我们定义了一个
MultinomialModel类,该类接受训练数据作为输入,并能够返回多项式模型的参数。类内部包括构造设计矩阵的方法、拟合数据的方法(使用梯度下降法)以及预测方法。
代码
class MultinomialModel:def __init__(self, degree):self.degree = degreeself.coefficients = Nonedef _design_matrix(self, X):"""构造设计矩阵"""n_samples = len(X)design_matrix = np.ones((n_samples, self.degree + 1))for i in range(1, self.degree + 1):design_matrix[:, i] = X ** ireturn design_matrixdef fit(self, X, Y, learning_rate=0.01, iterations=1000):"""使用梯度下降法来拟合模型"""n_samples = len(X)self.coefficients = np.zeros(self.degree + 1) # 初始化系数# 构造设计矩阵X_design = self._design_matrix(X)for _ in range(iterations):# 预测predictions = np.dot(X_design, self.coefficients)# 损失函数的导数gradient = 2 / n_samples * np.dot(X_design.T, predictions - Y)# 更新系数self.coefficients -= lea