参考:
https://makersportal.com/blog/2020/4/24/geographic-visualizations-in-python-with-cartopy
https://scitools.org.uk/cartopy/docs/latest/
https://stackoverflow.com/questions/69465435/cartopy-show-tick-marks-of-axes
具体实现方式:
import csv
import numpy as np
import cartopy.crs as ccrs
import matplotlib.pyplot as plt
import cartopy.io.img_tiles as cimgt
from cartopy.mpl.ticker import LongitudeFormatter, LatitudeFormatter
import io
from urllib.request import urlopen, Request
from PIL import Imagedef image_spoof(self, tile): # this function pretends not to be a Python scripturl = self._image_url(tile) # get the url of the street map APIreq = Request(url) # start requestreq.add_header('User-agent','Anaconda 3') # add user agent to requestfh = urlopen(req) im_data = io.BytesIO(fh.read()) # get imagefh.close() # close urlimg = Image.open(im_data) # open image with PILimg = img.convert(self.desired_tile_form) # set image formatreturn img, self.tileextent(tile), 'lower' # reformat for cartopy################################
# parsing the ASOS coordinates
################################
#
asos_data = []
with open('asos-stations.txt','r') as dat_file:reader = csv.reader(dat_file)for row in reader:asos_data.append(row)row_delin = asos_data[3][0].split(' ')[:-1]
col_sizes = [len(ii) for ii in row_delin]col_header = []; iter_ii = 0
for ii,jj in enumerate(col_sizes):col_header.append(asos_data[2][0][iter_ii:iter_ii+col_sizes[ii]].replace(' ',''))iter_ii+=col_sizes[ii]+1call,names,lats,lons,elevs = [],[],[],[],[]
for row in asos_data[4:]:data = []; iter_cc = 0for cc in range(0,len(col_header)):data.append(row[0][iter_cc:iter_cc+col_sizes[cc]].replace('  ',''))iter_cc+=col_sizes[cc]+1call.append(data[3])names.append(data[4])lats.append(float(data[9]))lons.append(float(data[10]))elevs.append(float(data[11]))#######################################
# Formatting the Cartopy plot
#######################################
#
cimgt.Stamen.get_image = image_spoof # reformat web request for street map spoofing
osm_img = cimgt.Stamen('terrain-background') # spoofed, downloaded street mapfig = plt.figure(figsize=(12,9)) # open matplotlib figure
ax1 = plt.axes(projection=osm_img.crs) # project using coordinate reference system (CRS) of street map
ax1.set_title('ASOS Station Map',fontsize=16)
extent = [-124.7844079,-66.9513812, 24.7433195, 49.3457868] # Contiguous US bounds
# extent = [-74.257159,-73.699215,40.495992,40.915568] # NYC bounds
ax1.set_extent(extent) # set extents
ax1.set_xticks(np.linspace(extent[0],extent[1],7),crs=ccrs.PlateCarree()) # set longitude indicators
ax1.set_yticks(np.linspace(extent[2],extent[3],7)[1:],crs=ccrs.PlateCarree()) # set latitude indicators
lon_formatter = LongitudeFormatter(number_format='0.1f',degree_symbol='',dateline_direction_label=True) # format lons
lat_formatter = LatitudeFormatter(number_format='0.1f',degree_symbol='') # format lats
ax1.xaxis.set_major_formatter(lon_formatter) # set lons
ax1.yaxis.set_major_formatter(lat_formatter) # set lats
ax1.xaxis.set_tick_params(labelsize=14)
ax1.yaxis.set_tick_params(labelsize=14)scale = np.ceil(-np.sqrt(2)*np.log(np.divide((extent[1]-extent[0])/2.0,350.0))) # empirical solve for scale based on zoom
scale = (scale<20) and scale or 19 # scale cannot be larger than 19
ax1.add_image(osm_img, int(scale)) # add OSM with zoom specification#######################################
# Plot the ASOS stations as points
#######################################
#
ax1.plot(lons, lats, markersize=5,marker='o',linestyle='',color='#3b3b3b',transform=ccrs.PlateCarree())plt.show()
代码来源:https://makersportal.com/blog/2020/4/24/geographic-visualizations-in-python-with-cartopy
属性设置:
(1)自定义显示经纬度label:ax1.set_xticks([100,110,120], crs=ccrs.PlateCarree()) ax1.set_yticks([20, 25,30,35, 40,45], crs=ccrs.PlateCarree())
(2)经纬度label保留整数,并显示小圆圈:lon_formatter = LongitudeFormatter(number_format='0.0f',degree_symbol='°',dateline_direction_label=True) # format lons lat_formatter = LatitudeFormatter(number_format='0.0f',degree_symbol='°') # format lats
显示效果:

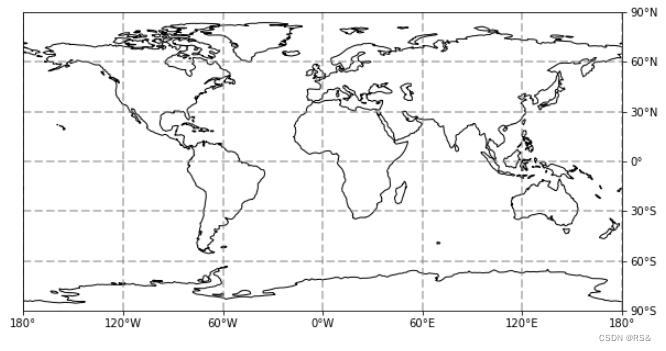
完整代码:
import matplotlib.pyplot as plt
import cartopy.crs as ccrsfrom cartopy.mpl.ticker import (LongitudeFormatter, LatitudeFormatter,LatitudeLocator, LongitudeLocator)fig, ax = plt.subplots(figsize=(10, 5), subplot_kw={"projection":ccrs.PlateCarree()})ax.coastlines()ax.yaxis.tick_right()
ax.set_xticks([-180,-120, -60, 0, 60, 120, 180], crs=ccrs.PlateCarree())
ax.set_yticks([-90, -60, -30, 0, 30, 60, 90], crs=ccrs.PlateCarree())
lon_formatter = LongitudeFormatter(zero_direction_label=True)
lat_formatter = LatitudeFormatter()
ax.xaxis.set_major_formatter(lon_formatter)
ax.yaxis.set_major_formatter(lat_formatter)gl = ax.gridlines(crs=ccrs.PlateCarree(), draw_labels=False,linewidth=2, color='gray', alpha=0.5, linestyle='--')
代码来源:https://stackoverflow.com/questions/69465435/cartopy-show-tick-marks-of-axes
显示结果: