【小白从小学Python、C、Java】
【考研初试+复试+毕业设计】
【Python基础+AI+数据分析】
Python中的数据可视化:
桑基图
Sankey
[太阳]选择题
根据给定的Python代码,哪个选项是正确的?
import matplotlib.pyplot as plt
from matplotlib.sankey import Sankey
sankey = Sankey(unit="kg")
a=[0.25, 0.15, -0.1, -0.15, -0.05, -0.05, -0.05]
b=['Input 1', 'Input 2', 'Output 1', 'Output 2', 'Output 3', 'Loss 1', 'Loss 2']
c=[1, -1, 1, 1, 0, -1, -1]
print(f"【显示】a,b,c\n{a}\n{b}\n{c}")
print("【执行】sankey.add(flows=a,labels=b,orientations=c)")
print("【执行】sankey.finish()")
sankey.add(flows=a,labels=b,orientations=c)
sankey.finish()
plt.show()
A选项:flows参数是流量的标签
B选项:labels参数是流量的列表
C选项:orientations参数是箭头的方向
D选项:sankey.finish()用于创建对象
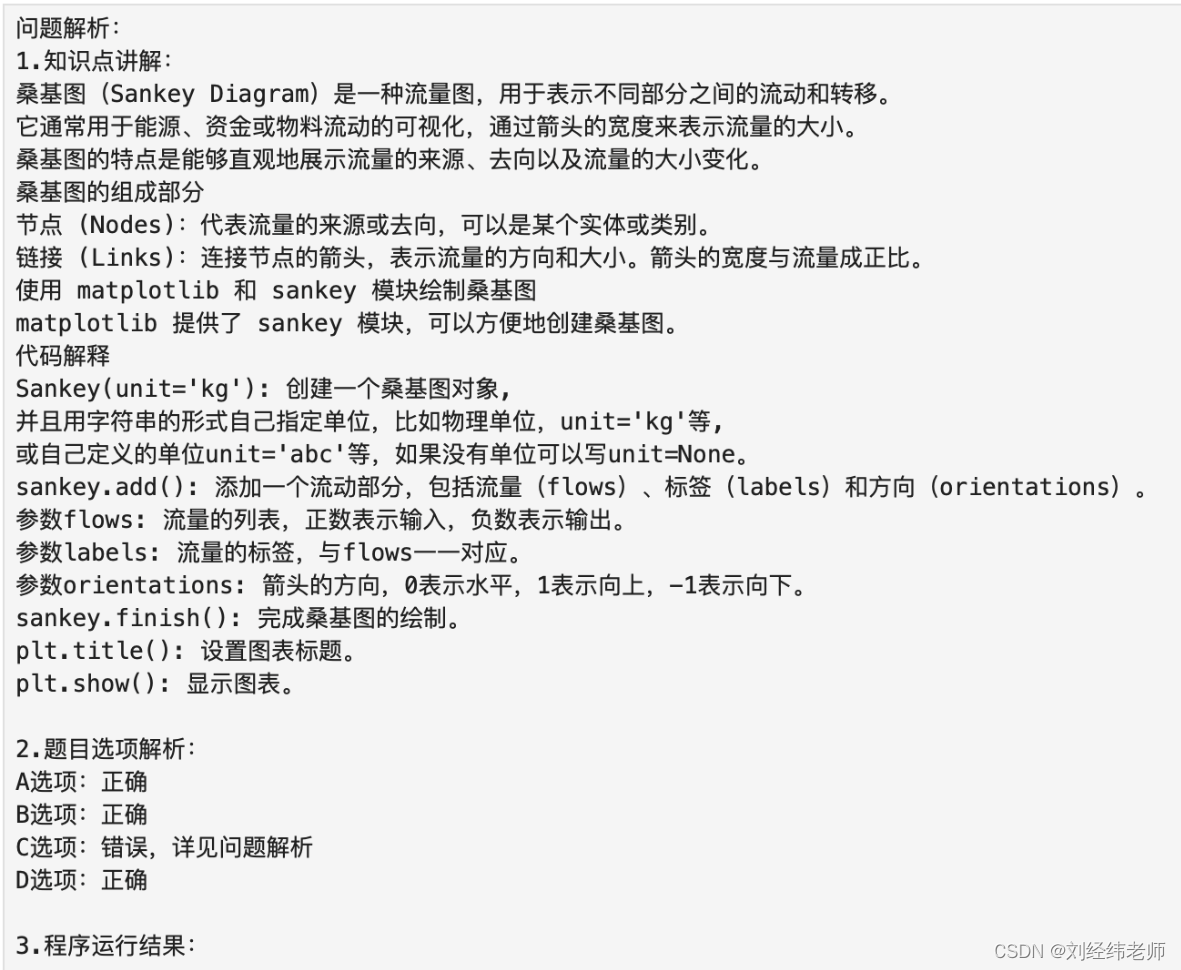
题目解析
代码示例

正确答案是C