内存泄漏问题定位
gperftools工具安装
执行如下操作:
git clone https://github.com/gperftools/gperftools.git
注:如果网速较慢,可直接去下载压缩包。
如我下载的地址:https://github.com/gperftools/gperftools/releases/tag/gperftools-2.15
tar -zxvf gperftools-2.15.tar.gz
cd gperftools-2.15/
./configure
编译:
make -j8
安装:
sudo make install注:查看pprof安装路径
lx@lx-virtual-machine:~/tcmalloc/gperftools-2.15$ ls /usr/local/bin/pprof*
/usr/local/bin/pprof  /usr/local/bin/pprof-symbolize注:查看tcmalloc库安装路径
lx@lx-virtual-machine:~/tcmalloc/gperftools-2.15$ ls /usr/local/lib/libtcmalloc*
/usr/local/lib/libtcmalloc.a                       /usr/local/lib/libtcmalloc_minimal_debug.a
/usr/local/lib/libtcmalloc_and_profiler.a          /usr/local/lib/libtcmalloc_minimal_debug.la
/usr/local/lib/libtcmalloc_and_profiler.la         /usr/local/lib/libtcmalloc_minimal_debug.so
/usr/local/lib/libtcmalloc_and_profiler.so         /usr/local/lib/libtcmalloc_minimal_debug.so.4
/usr/local/lib/libtcmalloc_and_profiler.so.4       /usr/local/lib/libtcmalloc_minimal_debug.so.4.5.16
/usr/local/lib/libtcmalloc_and_profiler.so.4.6.11  /usr/local/lib/libtcmalloc_minimal.la
/usr/local/lib/libtcmalloc_debug.a                 /usr/local/lib/libtcmalloc_minimal.so
/usr/local/lib/libtcmalloc_debug.la                /usr/local/lib/libtcmalloc_minimal.so.4
/usr/local/lib/libtcmalloc_debug.so                /usr/local/lib/libtcmalloc_minimal.so.4.5.16
/usr/local/lib/libtcmalloc_debug.so.4              /usr/local/lib/libtcmalloc.so
/usr/local/lib/libtcmalloc_debug.so.4.5.16         /usr/local/lib/libtcmalloc.so.4
/usr/local/lib/libtcmalloc.la                      /usr/local/lib/libtcmalloc.so.4.5.16
/usr/local/lib/libtcmalloc_minimal.a
刷新动态库:
sudo ldconfig
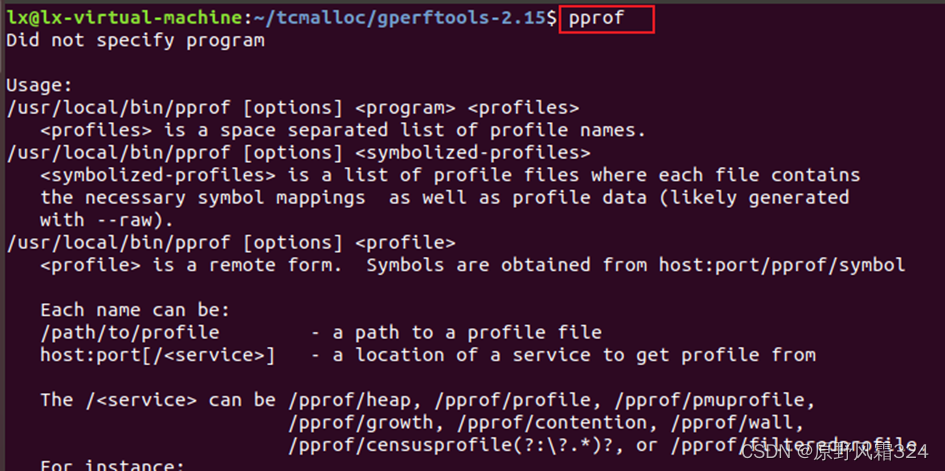
pprof命令测试:
pprof
注:如果出现命令选项即正确安装成功
Tcmalloc工具测试
测试程序如下
1 #include <stdio.h>2 #include <stdlib.h>3 4 void func_malloc(char* ch)5 {6 ch = (char *)malloc(sizeof(char));7 return ;8 }9 10 int main()11 {12 printf("hello world!\n");13 14 char* ch = NULL;15 func_malloc(ch);16 printf("ch-addr:%p\n", &ch);17 //free(ch);18 19 return 0;20 }
执行如下操作进行测试:
lx@lx-virtual-machine:~/tcmalloc$ gcc main.c -g
lx@lx-virtual-machine:~/tcmalloc$
lx@lx-virtual-machine:~/tcmalloc$
lx@lx-virtual-machine:~/tcmalloc$ ./a.out
hello world!
ch-addr:0x7ffd2f8b1cc0
lx@lx-virtual-machine:~/tcmalloc$ LD_PRELOAD=/usr/local/lib/libtcmalloc.so HEAPCHECK=normal ./a.out
No live heap object at 0x7fb1c907a890 to ignore
WARNING: Perftools heap leak checker is active -- Performance may suffer
hello world!
ch-addr:0x7ffcab46fd80
Have memory regions w/o callers: might report false leaks
Leak check _main_ detected leaks of 1 bytes in 1 objects
The 1 largest leaks:
*** WARNING: Cannot convert addresses to symbols in output below.
*** Reason: Cannot find 'pprof' (is PPROF_PATH set correctly?)
*** If you cannot fix this, try running pprof directly.
Leak of 1 bytes in 1 objects allocated from:@ 556bf2d04750 @ 556bf2d0478e @ 7fb1c88b4c87 @ 556bf2d0465a If the preceding stack traces are not enough to find the leaks, try running THIS shell command:pprof ./a.out "/tmp/a.out.56397._main_-end.heap" --inuse_objects --lines --heapcheck --edgefraction=1e-10 --nodefraction=1e-10 --gvIf you are still puzzled about why the leaks are there, try rerunning this program with HEAP_CHECK_TEST_POINTER_ALIGNMENT=1 and/or with HEAP_CHECK_MAX_POINTER_OFFSET=-1
If the leak report occurs in a small fraction of runs, try running with TCMALLOC_MAX_FREE_QUEUE_SIZE of few hundred MB or with TCMALLOC_RECLAIM_MEMORY=false, it might help find leaks more repeatab
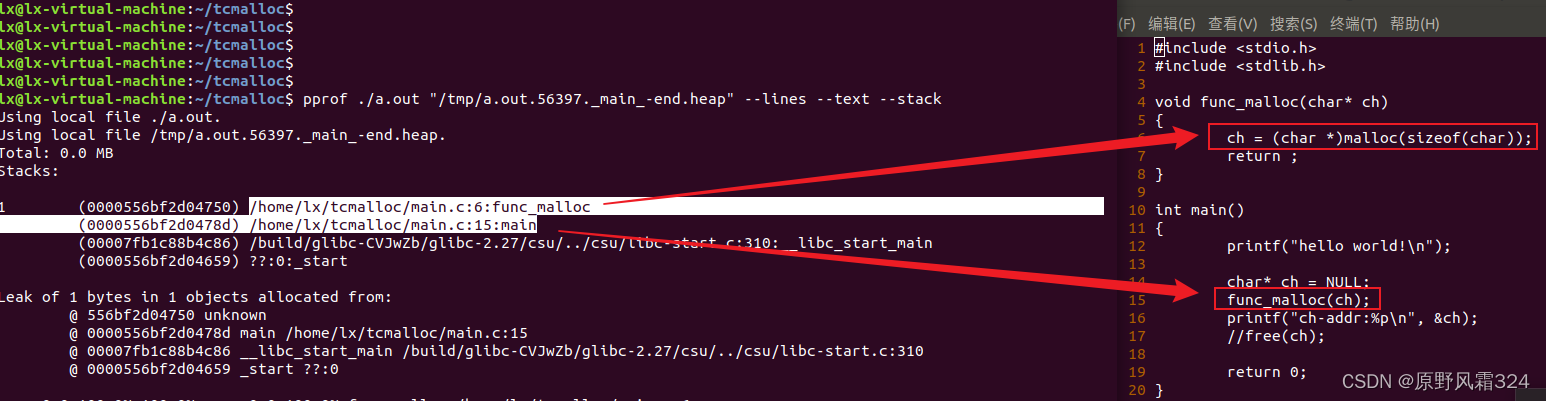
Exiting with error code (instead of crashing) because of whole-program memory leakslx@lx-virtual-machine:~/tcmalloc$ pprof ./a.out "/tmp/a.out.56397._main_-end.heap" --lines --text --stack
Using local file ./a.out.
Using local file /tmp/a.out.56397._main_-end.heap.
Total: 0.0 MB
Stacks:1 (0000556bf2d04750) /home/lx/tcmalloc/main.c:6:func_malloc(0000556bf2d0478d) /home/lx/tcmalloc/main.c:15:main(00007fb1c88b4c86) /build/glibc-CVJwZb/glibc-2.27/csu/../csu/libc-start.c:310:__libc_start_main(0000556bf2d04659) ??:0:_startLeak of 1 bytes in 1 objects allocated from:@ 556bf2d04750 unknown@ 0000556bf2d0478d main /home/lx/tcmalloc/main.c:15@ 00007fb1c88b4c86 __libc_start_main /build/glibc-CVJwZb/glibc-2.27/csu/../csu/libc-start.c:310@ 0000556bf2d04659 _start ??:00.0 100.0% 100.0% 0.0 100.0% func_malloc /home/lx/tcmalloc/main.c:60.0 0.0% 100.0% 0.0 100.0% __libc_start_main /build/glibc-CVJwZb/glibc-2.27/csu/../csu/libc-start.c:3100.0 0.0% 100.0% 0.0 100.0% _start ??:00.0 0.0% 100.0% 0.0 100.0% main /home/lx/tcmalloc/main.c:15
对比分析测试结果:
参考
https://blog.csdn.net/fpcc/article/details/136573180
https://qiushao.net/2020/07/11/Linux/memory-leak-analyze-tcmalloc/index.html