前言
在现代 Web 开发中,地图功能已经成为许多应用的重要组成部分。OpenLayers 是一个强大的开源地图库,支持多种地图源和地图操作。结合 Vue 3 的响应式特性,我们可以轻松实现地图的交互功能。本文将详细介绍如何在 Vue 3 中使用 OpenLayers 绘制点、线、圆和多边形。
技术栈
-
Vue 3:用于构建用户界面。
-
OpenLayers:用于地图渲染和交互。
-
Element Plus:用于 UI 组件(如下拉菜单)。
实现步骤
1. 环境准备
首先,确保你已经创建了一个 Vue 3 项目。如果还没有,可以通过以下命令创建一个:
npm create vue@latest然后安装 OpenLayers 和 Element Plus:
npm install ol element-plus2. 项目结构
在项目中创建一个组件,例如 OpenLayersMap.vue,用于实现地图绘制功能。
3. 代码实现
以下是完整的代码实现:
<!--* @Author: 彭麒* @Date: 2025/1/6* @Email: 1062470959@qq.com* @Description: 此源码版权归吉檀迦俐所有,可供学习和借鉴或商用。-->
<template><div class="container"><div class="w-full flex justify-center flex-wrap"><div class="font-bold text-[24px]">在Vue3中使用OpenLayers绘制点、线、圆、多边形</div></div><h4><el-select id="type" v-model="type" style="width: 240px;margin-top: 20px;margin-bottom: 20px"><el-option v-for="item in tools" :key="item.value" :value="item.value">{{ item.label }}</el-option></el-select></h4><div id="vue-openlayers"></div></div>
</template><script setup>
import { ref, watch, onMounted } from 'vue';
import 'ol/ol.css';
import { Map, View } from 'ol';
import Tile from 'ol/layer/Tile';
import OSM from 'ol/source/OSM';
import LayerVector from 'ol/layer/Vector';
import SourceVector from 'ol/source/Vector';
import Draw from 'ol/interaction/Draw';
import Fill from 'ol/style/Fill';
import Stroke from 'ol/style/Stroke';
import Style from 'ol/style/Style';
import Circle from 'ol/style/Circle';const type = ref('Polygon');
const tools = ref([{ value: 'Point', label: '点' },{ value: 'LineString', label: '线' },{ value: 'Polygon', label: '多边形' },{ value: 'Circle', label: '圆' },{ value: 'None', label: '无' }
]);const map = ref(null);
const draw = ref(null);
const source = new SourceVector({ wrapX: false });const initMap = () => {const raster = new Tile({source: new OSM()});const vector = new LayerVector({source: source,style: new Style({fill: new Fill({color: "#00f"}),stroke: new Stroke({width: 2,color: "#ff0",}),image: new Circle({radius: 5,fill: new Fill({color: '#ff0000'})}),})});map.value = new Map({target: 'vue-openlayers',layers: [raster, vector],view: new View({projection: "EPSG:4326",center: [113.1206, 23.034996],zoom: 10})});addInteraction();
};const addInteraction = () => {if (draw.value !== null) {map.value.removeInteraction(draw.value);}if (type.value !== 'None') {draw.value = new Draw({source: source,type: type.value,style: new Style({fill: new Fill({color: "#0f0"}),stroke: new Stroke({width: 2,color: "#f00",}),image: new Circle({radius: 5,fill: new Fill({color: '#00ff00'})}),})});map.value.addInteraction(draw.value);}
};watch(type, (newVal) => {addInteraction();
});onMounted(() => {initMap();
});
</script><style scoped>
.container {width: 840px;height: 590px;margin: 50px auto;border: 1px solid #42B983;
}#vue-openlayers {width: 800px;height: 400px;margin: 0 auto;border: 1px solid #42B983;position: relative;
}
</style>
4. 代码详解
4.1 地图初始化
-
使用
Map和View创建地图实例。 -
添加 OSM 底图和矢量图层。
-
设置地图的中心点和缩放级别。
4.2 绘制工具
-
使用
Draw实现点、线、圆和多边形的绘制。 -
通过
type动态切换绘制类型。 -
使用
Style设置绘制样式。
4.3 响应式交互
-
使用
watch监听type的变化,动态更新绘制工具。 -
使用
onMounted在组件挂载后初始化地图。
5. 运行效果
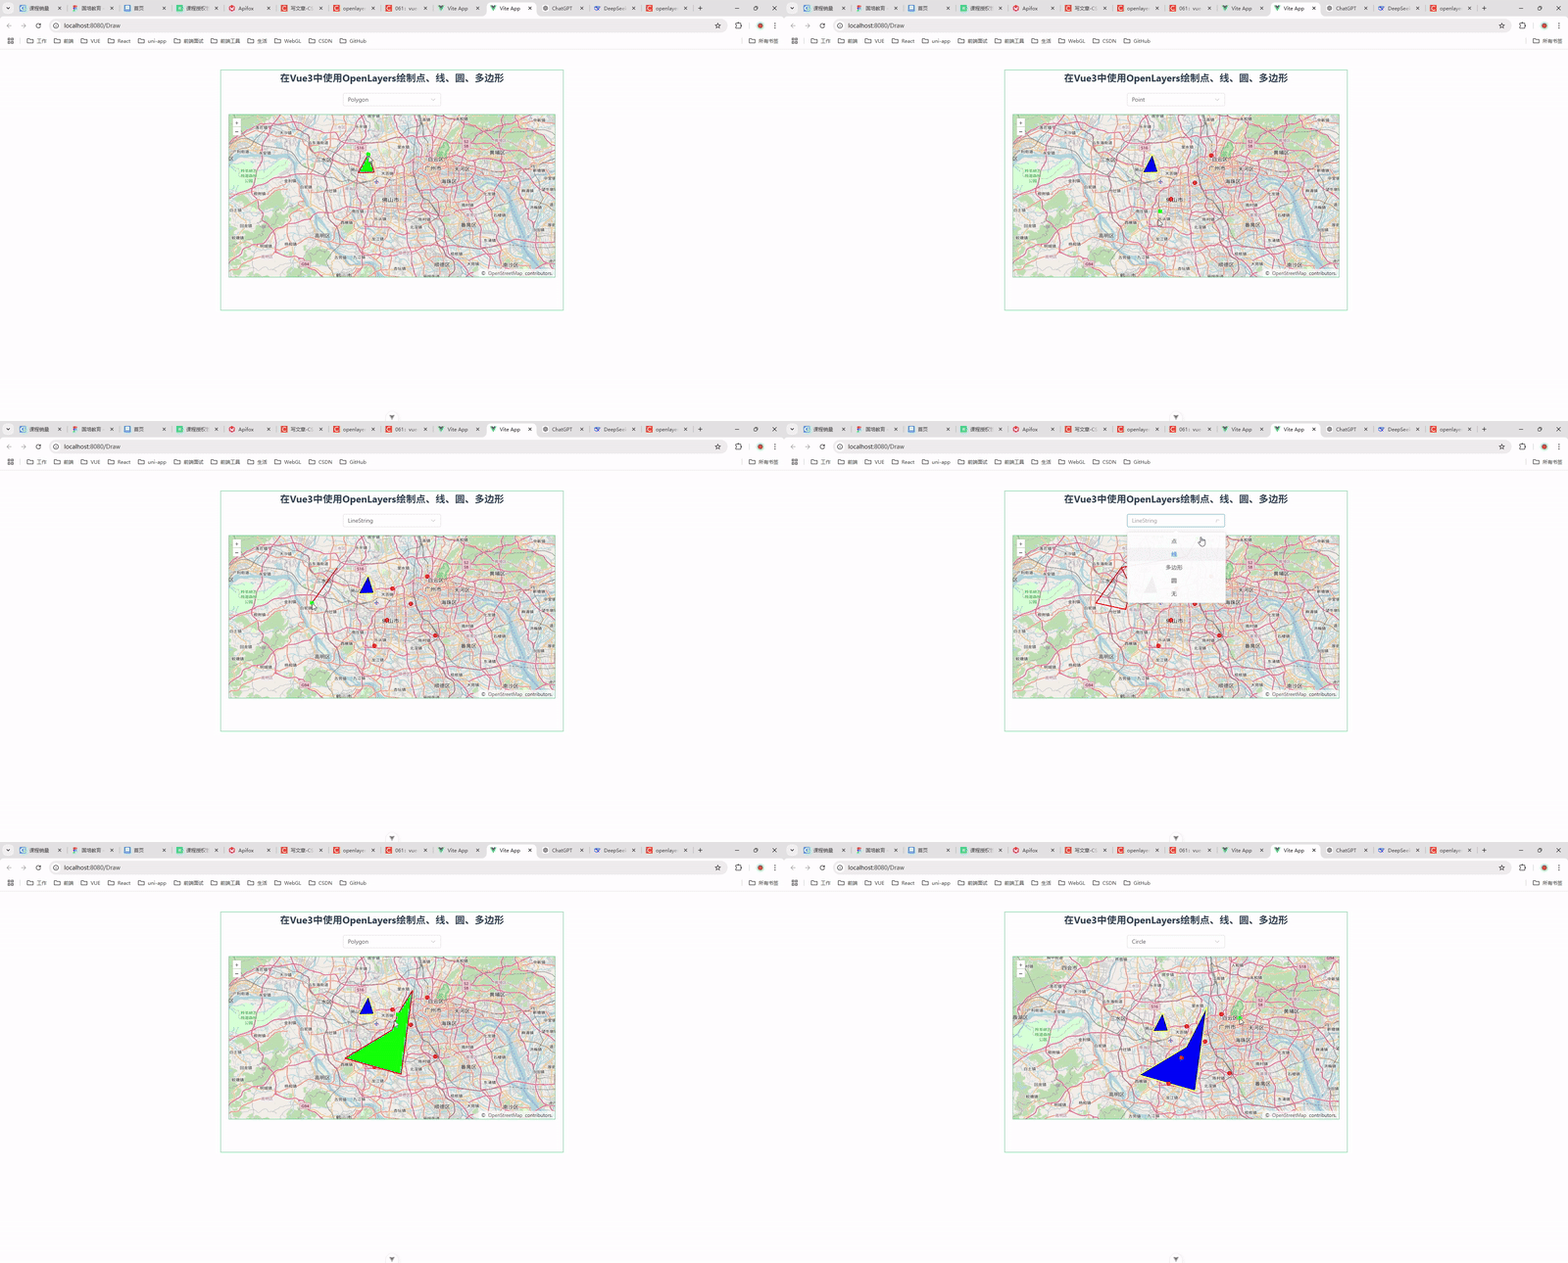
运行项目后,页面会显示一个地图和一个下拉菜单。用户可以通过下拉菜单选择绘制类型,然后在地图上绘制相应的图形。

总结
本文详细介绍了如何在 Vue 3 中使用 OpenLayers 实现点、线、圆和多边形的绘制功能。通过结合 Vue 3 的响应式特性和 OpenLayers 的强大功能,我们可以轻松实现复杂的地图交互。希望本文对你有所帮助,欢迎在评论区交流讨论!
参考文档
-
OpenLayers 官方文档
-
Vue 3 官方文档
-
Element Plus 官方文档
希望这篇博文能帮助你在 CSDN 上分享你的技术经验!如果有其他问题,欢迎随时提问!
