文章目录
- 前言
- 一、NuGet安装WebView2
- 二、代码部分
- 1.xaml中引入webview2
- 2.编写html
- 3.在WebView2中加载html
- 4.调用js方法为Echarts赋值
- 总结
前言
为了实现数据的三维效果,所以需要使用Echarts,但如何在WPF中使用Echarts呢?
一、NuGet安装WebView2

二、代码部分
1.xaml中引入webview2
xmlns:wv2="clr-namespace:Microsoft.Web.WebView2.Wpf;assembly=Microsoft.Web.WebView2.Wpf"
<wv2:WebView2 Name = "webview2"/>
2.编写html
写一个html文件(请注意写你自己Echarts.js的路径),放到项目中,html内容如下:
<!DOCTYPE html>
<html><head><title>Simple Surface</title><meta charset="utf-8"><script src="source/echarts.min.js"></script><script src="source/echarts-gl.min.js"></script>
</head><body><div id="main" style="width: 100%;height:300px;"></div>
</body><script type="text/javascript">var chartDom = document.getElementById('main');var myChart = echarts.init(chartDom);var data3d = [];var option;option = {tooltip: {},backgroundColor: '#fff',visualMap: {show: true,dimension: 2,min: -300,max: 100,inRange: {color: ['#313695', '#4575b4', '#74add1', '#abd9e9', '#e0f3f8', '#ffffbf', '#fee090', '#fdae61', '#f46d43', '#d73027', '#a50026']}},xAxis3D: {name: '纵向',type: 'value'},yAxis3D: {name: '横向',type: 'value'},zAxis3D: {name: '高程',type: 'value',min: -20,max: 30},grid3D: {viewControl: {projection: 'orthographic'}},series: [{name: "路面高程",type: 'surface',data: data3d,}]};option && myChart.setOption(option);
</script>
<script type="text/javascript">function setChartSize(width, height){console.log(width + "|"+height);document.getElementById('main').style.width = width + 'px';document.getElementById('main').style.height = height + 'px';myChart.resize();}function set3dData(data, min,max){console.log("设置数据中");data3d = data;option.visualMap.min = min;option.visualMap.max = max;myChart.resize();Draw3d();}function Draw3d(){option.series[0].data = data3d;myChart.setOption(option);}
</script>
</html>
3.在WebView2中加载html
在代码中加入如下方法,使webview2加载我们写好的html。
//初始化标识bool webview2_initialized = false;private async void InitializeWebView(){// 确保WebView2控件已经初始化await webview2.EnsureCoreWebView2Async(null);// 注册DOMContentLoaded事件,确保页面加载完成后调用JavaScript方法webview2.CoreWebView2.DOMContentLoaded += CoreWebView2_DOMContentLoaded;// 加载HTML内容var htmlFilePath = System.IO.Path.Combine(AppDomain.CurrentDomain.BaseDirectory + "你的路径", "index.html");this.webview2.CoreWebView2.Navigate(htmlFilePath);}private void CoreWebView2_DOMContentLoaded(object sender, CoreWebView2DOMContentLoadedEventArgs e){var width = this.webview2.ActualWidth - 20;var height = this.webview2.ActualHeight - 20;//webview2加载完成。webview2_initialized = true;//调用js中的setChartSize方法webview2.CoreWebView2.ExecuteScriptAsync("setChartSize(" + width + "," + height + ")");}
4.调用js方法为Echarts赋值
//检测webview2是否初始化完成。while (!webview2_initialized){//程序等待await Task.Delay(100);}//调用js方法为echart方法赋值。this.Dispatcher.Invoke(() =>{string jsString = "set3dData({0},{1},{2});";string[] data = 你的方法;jsString = String.Format(jsString, data[0], data[1], data[2]);if (webview2.CoreWebView2 != null) {//调用js代码webview2.CoreWebView2.ExecuteScriptAsync(jsString);}});
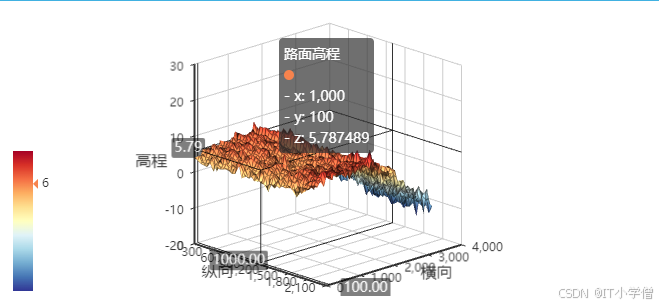
总结
完成上述操作后,就可以看到如下效果了。至此我们完成了WPF使用的Echarts的操作。感谢观看,下集再见。