LiveCharts 是一个开源的 .NET 图表库,特别适用于 WPF、WinForms 和其他 .NET 平台。它提供了丰富的图表类型和功能,使开发者能够轻松地在应用程序中创建动态和交互式图表。下面我将使用WPF平台创建一个测试实例。
一、LiveCharts的安装和使用
1.安装NuGet程序包
- 右键项目,点击管理 NuGet程序包

- 搜索LiveCharts并安装LiveCharts.WPF程序包

2.LiveCharts的功能
博主讲解了多种图表的使用:
WPF—LiveCharts图表_wpf livecharts-CSDN博客
- 折线图 (Line Chart)
- 柱状图 (Column Chart)
- 条形图 (Bar Chart)
- 面积图 (Area Chart)
- 圆饼图 (Pie Chart)
- 雷达图 (Radar Chart)
- 散点图 (Scatter Chart)
- 组合图 (Combination Chart)
- K线图 (Candlestick Chart)
- 子图 (Subcharts)
其他功能
- 动态图表: 支持实时数据更新。
- 动画效果: 提供平滑的过渡动画。
- 自定义样式: 可以根据需求自定义颜色、样式和标签格式。
- 交互功能: 支持缩放、平移等用户交互。
二、折线图实例
注意:在本过程中我使用了 CommunityToolkit 程序包,通过它直接使用了MVVM模式架构(安装如下图的程序安装包即可)。

文件夹

1.ViewModel.cs
下面代码已加详细的注释。
using CommunityToolkit.Mvvm.ComponentModel;
using CommunityToolkit.Mvvm.Input;
using LiveCharts;
using LiveCharts.Wpf;
using System.Timers;
using System.Windows.Media;namespace LiveCharts实验.ViewModels
{public partial class 折线图ViewModel : ObservableObject{#region 属性声明public SeriesCollection LineSeriesCollection { get; set; } //SeriesCollection 是 LiveCharts 提供的类,用于存放多个数据系列public Func<double, string> CustomFormatterX { get; set; } //格式化 X 轴的标签。可以自定义显示的格式public Func<double, string> CustomFormatterY { get; set; } //格式化 Y 轴的标签。可以自定义显示的格式private double axisXMax;public double AxisXMax //X轴的最大显示范围{get { return axisXMax; }set { axisXMax = value; this.OnPropertyChanged("AxisXMax"); }}private double axisXMin;public double AxisXMin //X轴的最小值{get { return axisXMin; }set { axisXMin = value; this.OnPropertyChanged("AxisXMin"); }}private double axisYMax;public double AxisYMax //Y轴的最大显示范围{get { return axisYMax; }set{axisYMax = value;this.OnPropertyChanged("AxisYMax");}}private double axisYMin;public double AxisYMin //Y轴的最小值{get { return axisYMin; }set { axisYMin = value; this.OnPropertyChanged("AxisYMin");}}private System.Timers.Timer timer = new System.Timers.Timer(); //声明一个定时器实例private Random Randoms = new Random(); //随机数生成器private int TabelShowCount = 10; //表示在图表中显示的最大点数   private List<ChartValues<double>> ValueLists { get; set; } //存储 Y 轴的数据点private List<Axis> YAxes { get; set; } = new List<Axis>();private string CustomFormattersX(double val) //格式化 X 轴的标签{return string.Format("{0}", val); //可以初始化为时间等}private string CustomFormattersY(double val) //格式化  Y 轴的标签{return string.Format("{0}", val);}#endregionpublic 折线图ViewModel(){AxisXMax = 10; //初始化X轴的最大值为10AxisXMin = 0; //初始化X轴的最小值为0AxisYMax = 10; //初始化Y轴的最大值为10AxisYMin = 0; //初始化Y轴的最小值为0ValueLists = new List<ChartValues<double>> // 初始化六个数据曲线的值集合{new ChartValues<double>(),new ChartValues<double>(),new ChartValues<double>(),new ChartValues<double>(),new ChartValues<double>(),new ChartValues<double>()};LineSeriesCollection = new SeriesCollection(); //创造LineSeriesCollection的实例CustomFormatterX = CustomFormattersX; //设置X轴自定义格式化函数CustomFormatterY = CustomFormattersY; //设置Y轴自定义格式化函数var colors = new[] //初始化一个颜色数组供线条颜色使用{Brushes.Red,Brushes.Green,Brushes.Blue,Brushes.Orange,Brushes.Purple,Brushes.Teal};for (int i = 0; i < 6; i++) // 创建六个 LineSeries 并添加到LineSeriesCollection集合中{LineSeries lineseries = new LineSeries{Title = $"曲线 {i + 1}", // 设置曲线名称DataLabels = false, // 数据标签不可见Values = ValueLists[i], // Y 轴数值绑定到相应的 ValueListStrokeThickness = 3, // 设置线条的宽度PointGeometrySize = 8, // 设置数据点的大小LineSmoothness = 0.5, // 设置折线的弯折度 (0: 直线, 1: 完全平滑)Stroke = colors[i % colors.Length], // 设置每条曲线的颜色Fill = Brushes.Transparent // 去掉阴影};LineSeriesCollection.Add(lineseries); // 添加到 LineSeriesCollection 中}timer.Interval = 1000; //设置定时器间隔为1000毫秒,即1秒触发一次定时器订阅的事件timer.Enabled = false; //定时器初始未打开,需要手动打开timer.Elapsed += 打开定时器了; //定时器打开订阅的事件AppDomain.CurrentDomain.ProcessExit += OnProcessExit; //定时器关闭订阅的事件}[RelayCommand]private void 添加数据(){for (int i = 0; i < ValueLists.Count; i++)  // 为每条曲线生成一个随机的 Y 值并添加{int yValue = Randoms.Next(2, 1000); // 生成随机数ValueLists[i].Add(yValue); // 向对应的曲线添加数据}int maxY = (int)ValueLists.Select(v => v.Max()).Max(); // 获取所有曲线的最大值AxisYMax = maxY + 30; // 将 Y 轴的最大值设置为这个最大值加上 30if (ValueLists[0].Count > TabelShowCount) // 仅检查第一条曲线的数据点数量{AxisXMax = ValueLists[0].Count - 1; // X 轴最大值AxisXMin = ValueLists[0].Count - TabelShowCount; // X 轴最小值}}[RelayCommand]private void 定时添加数据(){if (timer.Enabled == false) //判断定时器是否是打开状态,如果没有打开就打开定时器添加数据;{timer.Start();}   else{timer.Stop(); //如果已经打开定时器,那么这次点击按钮就是关闭定时器,停止添加数据timer.Dispose();}}private void 打开定时器了(object sender, ElapsedEventArgs e) //定时器打开后订阅的事件{for (int i = 0; i < ValueLists.Count; i++)  // 为每条曲线生成一个随机的 Y 值并添加{int yValue = Randoms.Next(2, 1000); // 生成随机数ValueLists[i].Add(yValue); // 向对应的曲线添加数据}int maxY = (int)ValueLists.Select(v => v.Max()).Max(); // 获取所有曲线的最大值AxisYMax = maxY + 30; // 将 Y 轴的最大值设置为这个最大值加上 30if (ValueLists[0].Count > TabelShowCount) // 仅检查第一条曲线的数据点数量{AxisXMax = ValueLists[0].Count - 1; // X 轴最大值AxisXMin = ValueLists[0].Count - TabelShowCount; // X 轴最小值}}private void OnProcessExit(object? sender, EventArgs e) //进程退出时订阅的事件{try{timer.Stop(); //关闭定时器timer.Dispose(); //释放资源}catch { }}}
}
2.View.xaml.cs
using LiveCharts实验.ViewModels;
using System.Windows;namespace LiveCharts实验.Views
{public partial class 折线图View : Window{private 折线图ViewModel ViewModel = new 折线图ViewModel();public 折线图View(){InitializeComponent();DataContext = ViewModel;}}
}
3.View.xaml
<Window x:Class="LiveCharts实验.Views.折线图View"xmlns="http://schemas.microsoft.com/winfx/2006/xaml/presentation"xmlns:x="http://schemas.microsoft.com/winfx/2006/xaml"xmlns:d="http://schemas.microsoft.com/expression/blend/2008"xmlns:mc="http://schemas.openxmlformats.org/markup-compatibility/2006"xmlns:lvc="clr-namespace:LiveCharts.Wpf;assembly=LiveCharts.Wpf"xmlns:local="clr-namespace:LiveCharts实验.Views"mc:Ignorable="d"Title="折线图View" Width="1700" Height="1400"><Grid><Grid.RowDefinitions><RowDefinition Height="50"/><RowDefinition Height="*"/></Grid.RowDefinitions><Grid Grid.Row="0" Background="AntiqueWhite"><Button Content="测试" Margin="0,10,0,0" HorizontalAlignment="Left" VerticalAlignment="Top" Width="75"Command="{Binding 添加数据Command}"/><Button Content="定时添加数据" Margin="80,10,0,0" HorizontalAlignment="Left" VerticalAlignment="Top" Width="95"Command="{Binding 定时添加数据Command}" /></Grid><Grid Grid.Row="1"><lvc:CartesianChart Series="{Binding LineSeriesCollection}" LegendLocation="Right" AnimationsSpeed="00:00:00.500"Zoom ="Xy"Pan="X"><lvc:CartesianChart.AxisX><lvc:Axis LabelFormatter="{Binding CustomFormatterX}" MaxValue="{Binding AxisXMax}" MinValue="{Binding AxisXMin}"><lvc:Axis.Separator><lvc:Separator Step="1" /></lvc:Axis.Separator></lvc:Axis></lvc:CartesianChart.AxisX><lvc:CartesianChart.AxisY><lvc:Axis Foreground="red"MaxValue="{Binding AxisYMax}" MinValue="{Binding AxisYMin}"></lvc:Axis><lvc:Axis Foreground="Green"MaxValue="{Binding AxisYMax}" MinValue="{Binding AxisYMin}"></lvc:Axis><lvc:Axis Foreground="Blue"MaxValue="{Binding AxisYMax}" MinValue="{Binding AxisYMin}"></lvc:Axis><lvc:Axis Foreground="Orange"Position="RightTop"MaxValue="{Binding AxisYMax}" MinValue="{Binding AxisYMin}"></lvc:Axis><lvc:Axis Foreground="Purple"Position="RightTop"MaxValue="{Binding AxisYMax}" MinValue="{Binding AxisYMin}"></lvc:Axis><lvc:Axis Foreground="Teal"Position="RightTop"MaxValue="{Binding AxisYMax}" MinValue="{Binding AxisYMin}"></lvc:Axis></lvc:CartesianChart.AxisY></lvc:CartesianChart></Grid></Grid>
</Window>
解释:
<lvc:CartesianChart>: 创建了一个二维 Cartesian 图表。
Series="{Binding LineSeriesCollection}": 绑定图表的数据系列集合到LineSeriesCollection。这个集合在 ViewModel 中定义。LegendLocation="Right": 指定图例的位置在右侧。- AnimationsSpeed="00:00:00.500":动画的速度。
- DrawMargin="{Binding ChartMargin}":图表边距(代码中无)
Zoom="Xy": 允许用户在 X 和 Y 轴上进行缩放。Pan="X": 允许用户在 X 轴上拖动(平移)。
<lvc:CartesianChart.AxisX>: 定义 X 轴的属性。
LabelFormatter="{Binding CustomFormatterX}": 绑定 X 轴标签格式化函数到CustomFormatterX,用于自定义标签的显示格式(例如:显示为“天”)。MaxValue="{Binding AxisXMax}"和MinValue="{Binding AxisXMin}": 绑定 X 轴的最大和最小值,以动态控制显示范围。<lvc:Axis.Separator>: 定义网格线的分隔符。<lvc:Separator Step="1" />: 设置网格线的间隔为 1。
<lvc:CartesianChart.AxisY>: 定义 Y 轴的属性。
- 多个
<lvc:Axis>元素: 你定义了多个 Y 轴,分别为红色、绿色、蓝色、橙色、紫色和青色。每条曲线使用不同的 Y 轴,这通常用于不同数据范围的曲线。 Foreground属性: 设置 Y 轴标签和网格线的颜色。Position属性: 设置了部分 Y 轴在右上角。这个属性用于控制 Y 轴的位置(默认是在左侧)。
在此处多个Y轴应该与使用中的数据绑定好。
4.实验结果
4.1.通过按钮添加曲线数据集单个数据

4.2.定时添加多个数据并动态显示

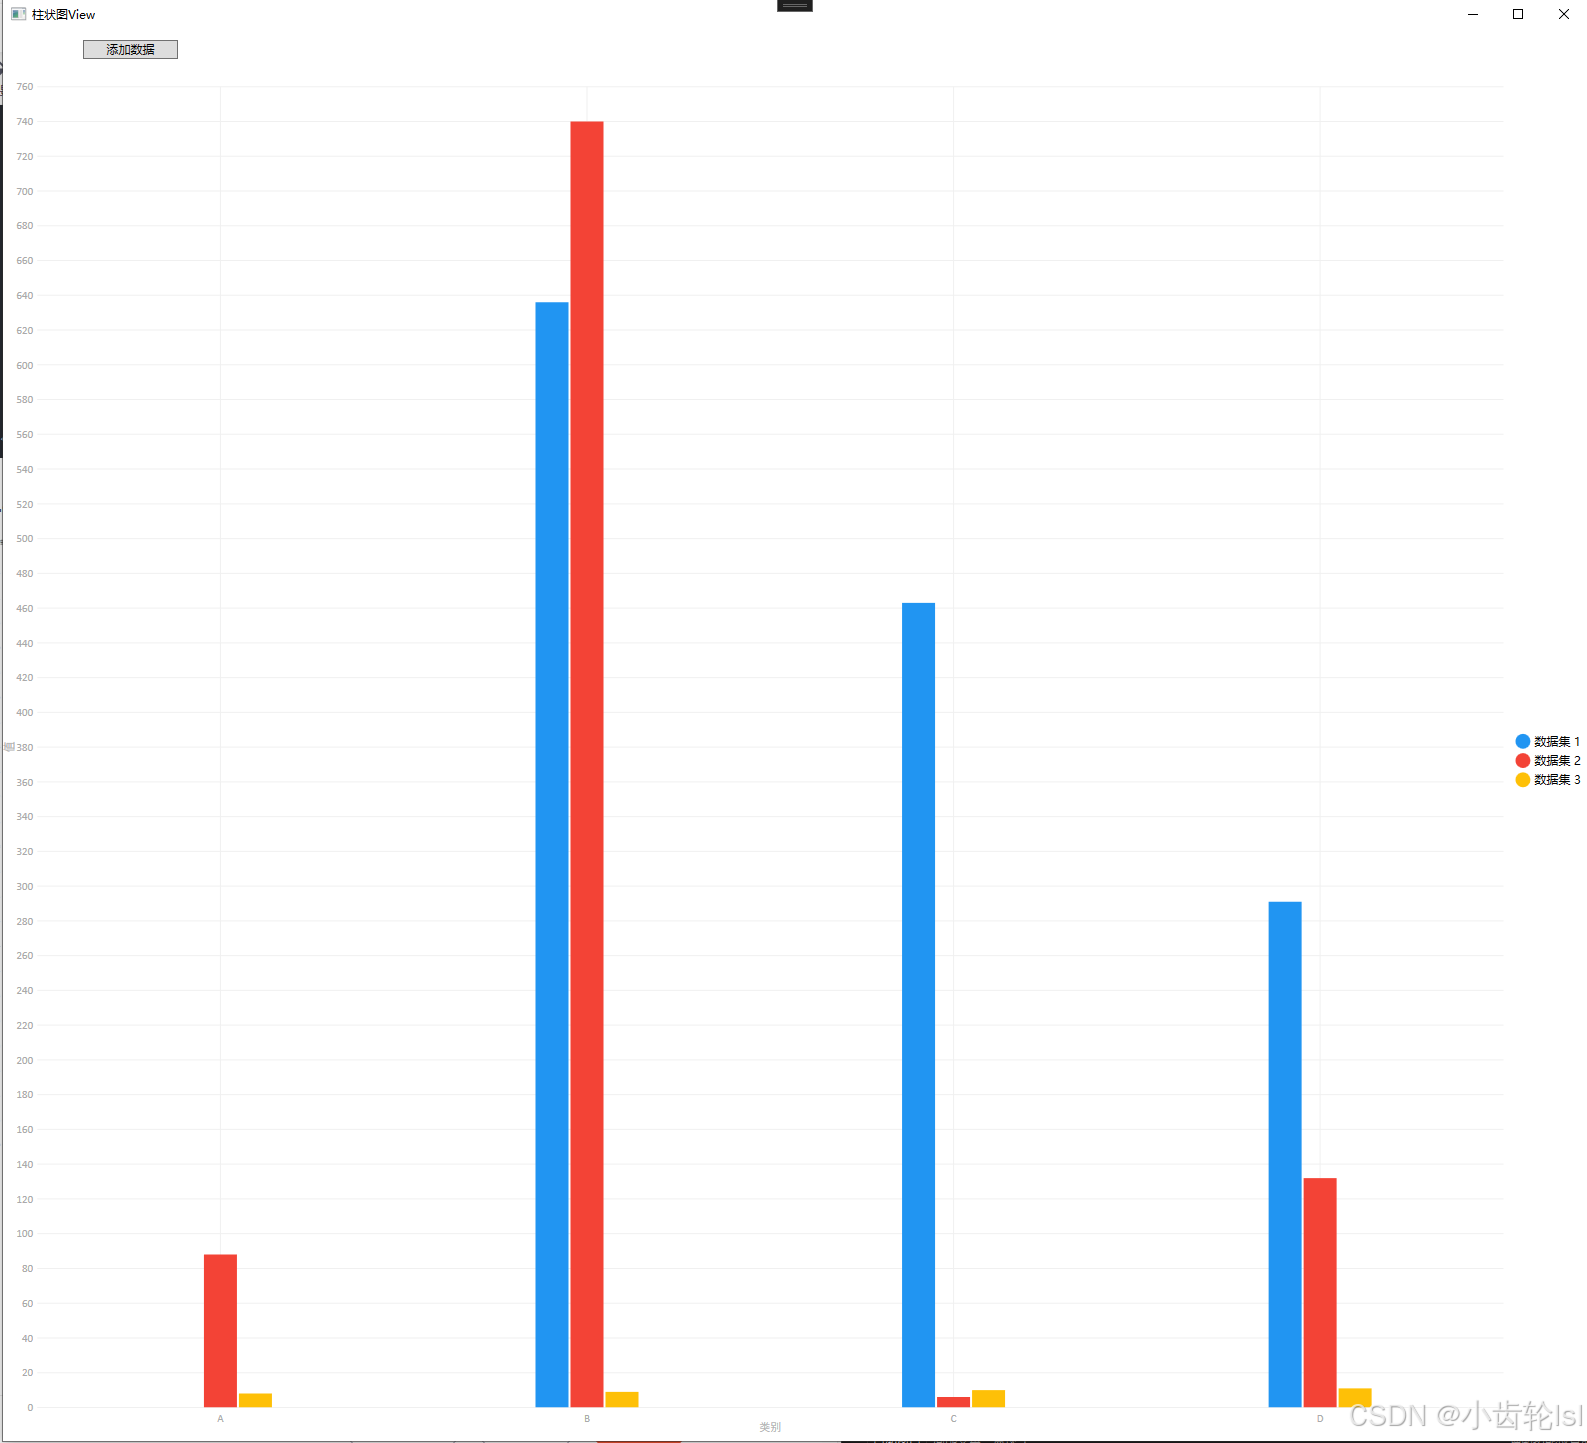
三、柱状图实例
1.ViewModel.cs
using LiveCharts.Wpf;
using LiveCharts;
using CommunityToolkit.Mvvm.ComponentModel;
using CommunityToolkit.Mvvm.Input;namespace LiveCharts实验.ViewModels
{public partial class 柱状图ViewModel : ObservableObject{#region 属性声明private SeriesCollection _columnValues;public SeriesCollection ColumnValues{get { return _columnValues; }set{_columnValues = value;OnPropertyChanged(nameof(ColumnValues));}}private string[] _axisXLabels = { "A", "B", "C", "D" };public string[] AxisXLabels{get { return _axisXLabels; }}private Random 随机索引 = new Random(); //随机数生成器private Random Randoms = new Random(); //随机数生成器#endregionpublic 柱状图ViewModel(){ColumnValues = new SeriesCollection // 初始化时创建柱状图数据{new ColumnSeries{Title = "数据集 1",Values = new ChartValues<double> { 0, 1, 2, 3 }},new ColumnSeries{Title = "数据集 2",Values = new ChartValues<double> { 4, 5, 6, 7 }},new ColumnSeries{Title = "数据集 3",Values = new ChartValues<double> { 8, 9, 10, 11 }}};}public void UpdateData(int index, int datasetIndex, double value) // 更新某个横坐标某个数据集的数据{if (index < 0 || index >= _axisXLabels.Length)throw new ArgumentOutOfRangeException(nameof(index), "索引超出范围");if (datasetIndex < 0 || datasetIndex >= ColumnValues.Count)throw new ArgumentOutOfRangeException(nameof(datasetIndex), "数据集索引超出范围");ColumnValues[datasetIndex].Values[index] = value; // 更新指定横坐标和数据集的数据OnPropertyChanged(nameof(ColumnValues)); // 通知数据已更新}[RelayCommand]private void 添加数据() //点击按键之后向随机索引的某一个数据添加一个随机数{UpdateData(随机索引.Next(0,4), 随机索引.Next(0,2), Randoms.Next(0,999));}}
}
2.View.xaml.cs
using LiveCharts实验.ViewModels;
using System.Windows;namespace LiveCharts实验.Views
{public partial class 柱状图View : Window{private 柱状图ViewModel viewModel = new 柱状图ViewModel();public 柱状图View(){InitializeComponent();DataContext = viewModel;}}
}
3.View.xaml
<Window x:Class="LiveCharts实验.Views.柱状图View"xmlns="http://schemas.microsoft.com/winfx/2006/xaml/presentation"xmlns:x="http://schemas.microsoft.com/winfx/2006/xaml"xmlns:d="http://schemas.microsoft.com/expression/blend/2008"xmlns:mc="http://schemas.openxmlformats.org/markup-compatibility/2006"xmlns:lv="clr-namespace:LiveCharts.Wpf;assembly=LiveCharts.Wpf"xmlns:local="clr-namespace:LiveCharts实验.Views"mc:Ignorable="d"Title="柱状图View" Height="1450" Width="1600"><Grid><Grid.RowDefinitions><RowDefinition Height="50"/><RowDefinition Height="*"/></Grid.RowDefinitions><Button Content="添加数据" Margin="80,10,0,0" HorizontalAlignment="Left" VerticalAlignment="Top" Width="95"Command="{Binding 添加数据Command}" /><lv:CartesianChart Series="{Binding ColumnValues}" Grid.Row="1"LegendLocation="Right"><lv:CartesianChart.AxisX><lv:Axis Title="类别" Labels="{Binding AxisXLabels}"/></lv:CartesianChart.AxisX><lv:CartesianChart.AxisY><lv:Axis Title="值"/></lv:CartesianChart.AxisY></lv:CartesianChart></Grid>
</Window>
4.实验结果

添加随机数后。