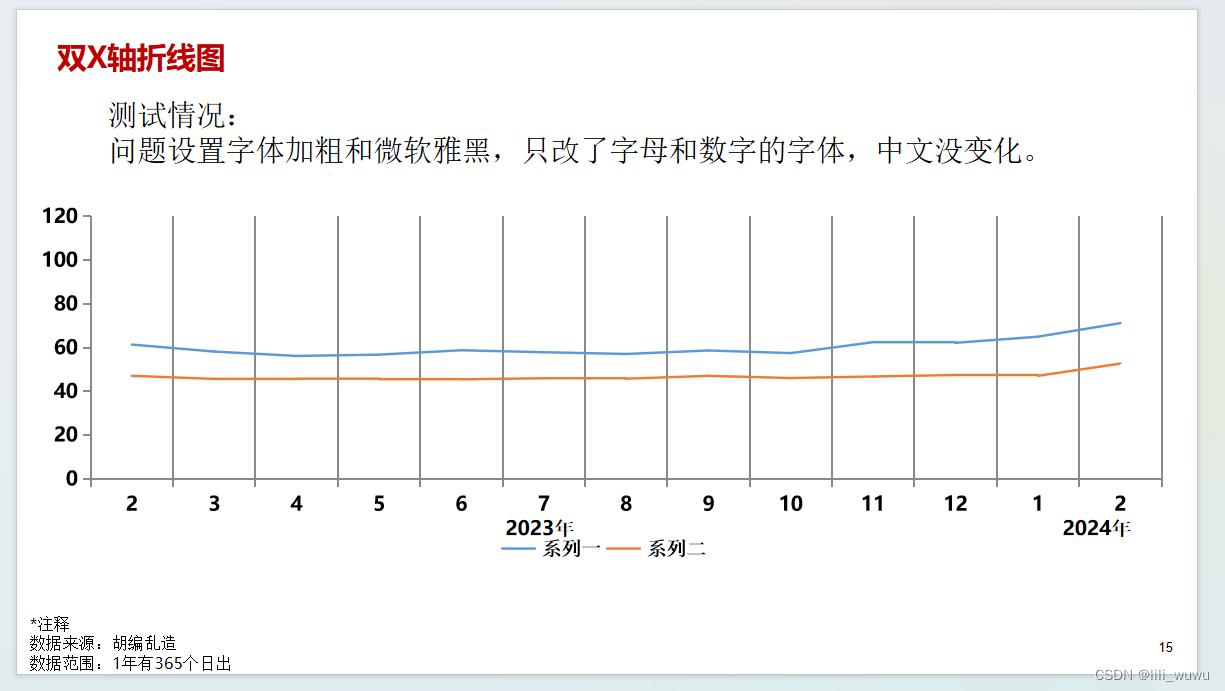
最终样式
代码实现
# 可编辑折线+写入文字 成功
# 问题: 设置字体类型和加粗和字体为微软雅黑,是只改了字母和数字的字体,中文没变化 pip install pptx_ea_font  这个库可以解决这个问题
import pandas as pd
import pptx_ea_font
import matplotlib.pyplot as plt
from pptx import Presentation
from pptx.util import Inches,Pt,Cm
from pptx.chart.data import ChartData,CategoryChartData
from pptx.dml.color import RGBColor
from pptx.enum.chart import XL_CHART_TYPE,XL_LABEL_POSITION,XL_LEGEND_POSITION,XL_TICK_MARK
path='E:\\13 python 下侧双x轴折线图\\'
df = pd.read_excel(path+'双x轴测试数据1.xlsx', sheet_name='Sheet4')  # 修改为你的文件名和工作表名#标题
tf_text='双x轴测试'
# 中间文本
tm_text='''测试情况:
问题设置字体加粗和微软雅黑,只改了字母和数字的字体,中文没变化''' # 三引号,自动换行
# 轴
td_text='                                          2023年                                                                                    2024年'
# 注释
tdd_text='''*注释
数据来源:胡编乱造
数据范围:1年有365个日出'''#轴字体
def zhou_font(tf,text_down):para = tf.add_paragraph()    # 新增段落para.text = text_down  # 向段落写入文字# para.alignment = PP_ALIGN.CENTER    # 居中para.line_spacing = 1    # 1.5 倍的行距### 设置字体font = para.fontfont.name = '微软雅黑'    # 字体类型font.bold = True    # 加粗font.size = Pt(12)  #下标注释字体
def text_downfont(tf,text_down):para = tf.add_paragraph()    # 新增段落para.text = text_down  # 向段落写入文字# para.alignment = PP_ALIGN.CENTER    # 居中para.line_spacing = 1    # 1.5 倍的行距### 设置字体font = para.fontfont.name = '微软雅黑'    # 字体类型font.bold = False    # 加粗font.size = Pt(10)  #正文字体
def text_font(tf,text_down):para = tf.add_paragraph()    # 新增段落para.text = text_down  # 向段落写入文字# para.alignment = PP_ALIGN.CENTER    # 居中para.line_spacing = 1    # 1.5 倍的行距### 设置字体font = para.font# pptx_ea_font.set_font(run,new_font)font.name = '微软雅黑'    # 字体类型font.bold = False    # 加粗font.size = Pt(20)  #标题字体
def text_titlefont(tf,text_down):para = tf.add_paragraph()    # 新增段落para.text = text_down  # 向段落写入文字# para.alignment = PP_ALIGN.CENTER    # 居中para.line_spacing = 0    # 1.5 倍的行距### 设置字体font = para.fontfont.name = '微软雅黑'    # 字体类型font.bold = True    # 加粗font.size = Pt(24) font.color.rgb = RGBColor(192, 0, 0)         # 设置颜色 红色 # 折线图样式
def line_chart_mod(chart):chart.has_legend = Truechart.legend.position = XL_LEGEND_POSITION.BOTTOM #图例chart.legend.font.size = Pt(12)chart.legend.font.bold = Truechart.legend.font.name = '微软雅黑'chart.show_value=True# x轴category_axis = chart.category_axiscategory_axis.has_major_gridlines = True# category_axis.minor_tick_mark = XL_TICK_MARK.OUTSIDE# category_axis.tick_labels.font.italic = False #斜体# category_axis.tick_labels.font.size = Pt(12)# tick_labels.number_format = '0"%"'tick_labels = category_axis.tick_labelstick_labels.font.bold = Truetick_labels.font.size = Pt(12)tick_labels.font.name = '微软雅黑'# y轴value_axis = chart.value_axisvalue_axis.maximum_scale = 120# value_axis.minor_tick_mark = XL_TICK_MARK.OUTSIDE value_axis.has_major_gridlines = Falsevalue_axis.has_minor_gridlines = Falsetick_labels = value_axis.tick_labels# tick_labels.number_format = '0"%"'tick_labels.font.bold = Truetick_labels.font.size = Pt(12)tick_labels.font.name = '微软雅黑'def paste_picture_content(path,df,tf_text,tm_text,td_text,tdd_text):prs = Presentation()       blank_slide_layout = prs.slide_layouts[6]               #选择模板中的空白页[6]slide = prs.slides.add_slide(blank_slide_layout)        #新建空白页[6]###添加折线图shapes = slide.shapes# shapes.title.text = '双x轴折线图'# 准备数据chart_data = ChartData()chart_data.categories = df['月份'] chart_data.add_series('系列一',  df['系列一']) #,number_format='0.0'轴展示数据形式chart_data.add_series('系列二',  df['系列二'])# 在幻灯片中添加折线图x, y, cx, cy =  Cm(0.25), Cm(6), Cm(24.78), Cm(8.2)    #left, top, width, heightchart=slide.shapes.add_chart(XL_CHART_TYPE.LINE, x, y, cx, cy, chart_data).chartplot = chart.plots[0]plot.has_data_labels = Truedata_labels = plot.data_labelsdata_labels.font.size = Pt(9)# data_labels.font.color.rgb = RGBColor('','')data_labels.position = XL_LABEL_POSITION.INSIDE_END# 修改折线图样式chart=line_chart_mod(chart)# chart = chart.chart# left, top, width, height = Cm(0.25), Cm(5), Cm(24.78), Cm(5.6)# pic = slide.shapes.add_picture(path+'chart.png', left, top, width, height)###确定文本框在空白ppt中的位置,以及文本框在的大小;将文本框在贴到空白页中#标题left, top, width, height = Cm(0.61), Cm(0.5), Cm(10), Cm(1.28)tf = slide.shapes.add_textbox(left=left, top=top, width=width, height=height).text_frame# tf.font.color.rgb = RGBColor(192, 0, 0)  # 字体颜色para = text_titlefont(tf,tf_text) # 中间文本left, top, width, height = Cm(1.7), Cm(2), Cm(8), Cm(0.5)tf = slide.shapes.add_textbox(left=left, top=top, width=width, height=height).text_frame# tf.text = tm_text  para = text_font(tf,tm_text) #轴left, top, width, height = Cm(5), Cm(12), Cm(8), Cm(1)tf = slide.shapes.add_textbox(left=left, top=top, width=width, height=height).text_frame # 在指定位置添加文本框para = zhou_font(tf,td_text)# 注释left, top, width, height = Cm(0.03), Cm(16.1), Cm(18), Cm(1)tf = slide.shapes.add_textbox(left=left, top=top, width=width, height=height).text_frame# tf.paragraphs[0].text = tdd_text para = text_downfont(tf,tdd_text) prs.save(path+'line_chart05.pptx')
paste_picture_content(path,df,tf_text,tm_text,td_text,tdd_text)
参考:https://python-pptx.readthedocs.io/en/latest/user/charts.html#line-chart
# pip install python-pptx