Grafana告警步骤
配置一个告警分为3步:添加告警规则->添加联络点->添加通知策略
这里就不一一介绍了
注意点
1.首先要配置联络点,可以查官方文档或者ai一个,可以直接用Test测试能否发送,联络点模板若不符合格式,发送不出去,但是不会报错,仍显示发送成功,实际并没收到。
许多样式都用不了,比如时间尝试了很多种格式都没出来,文末给了2种可用的联络点模板
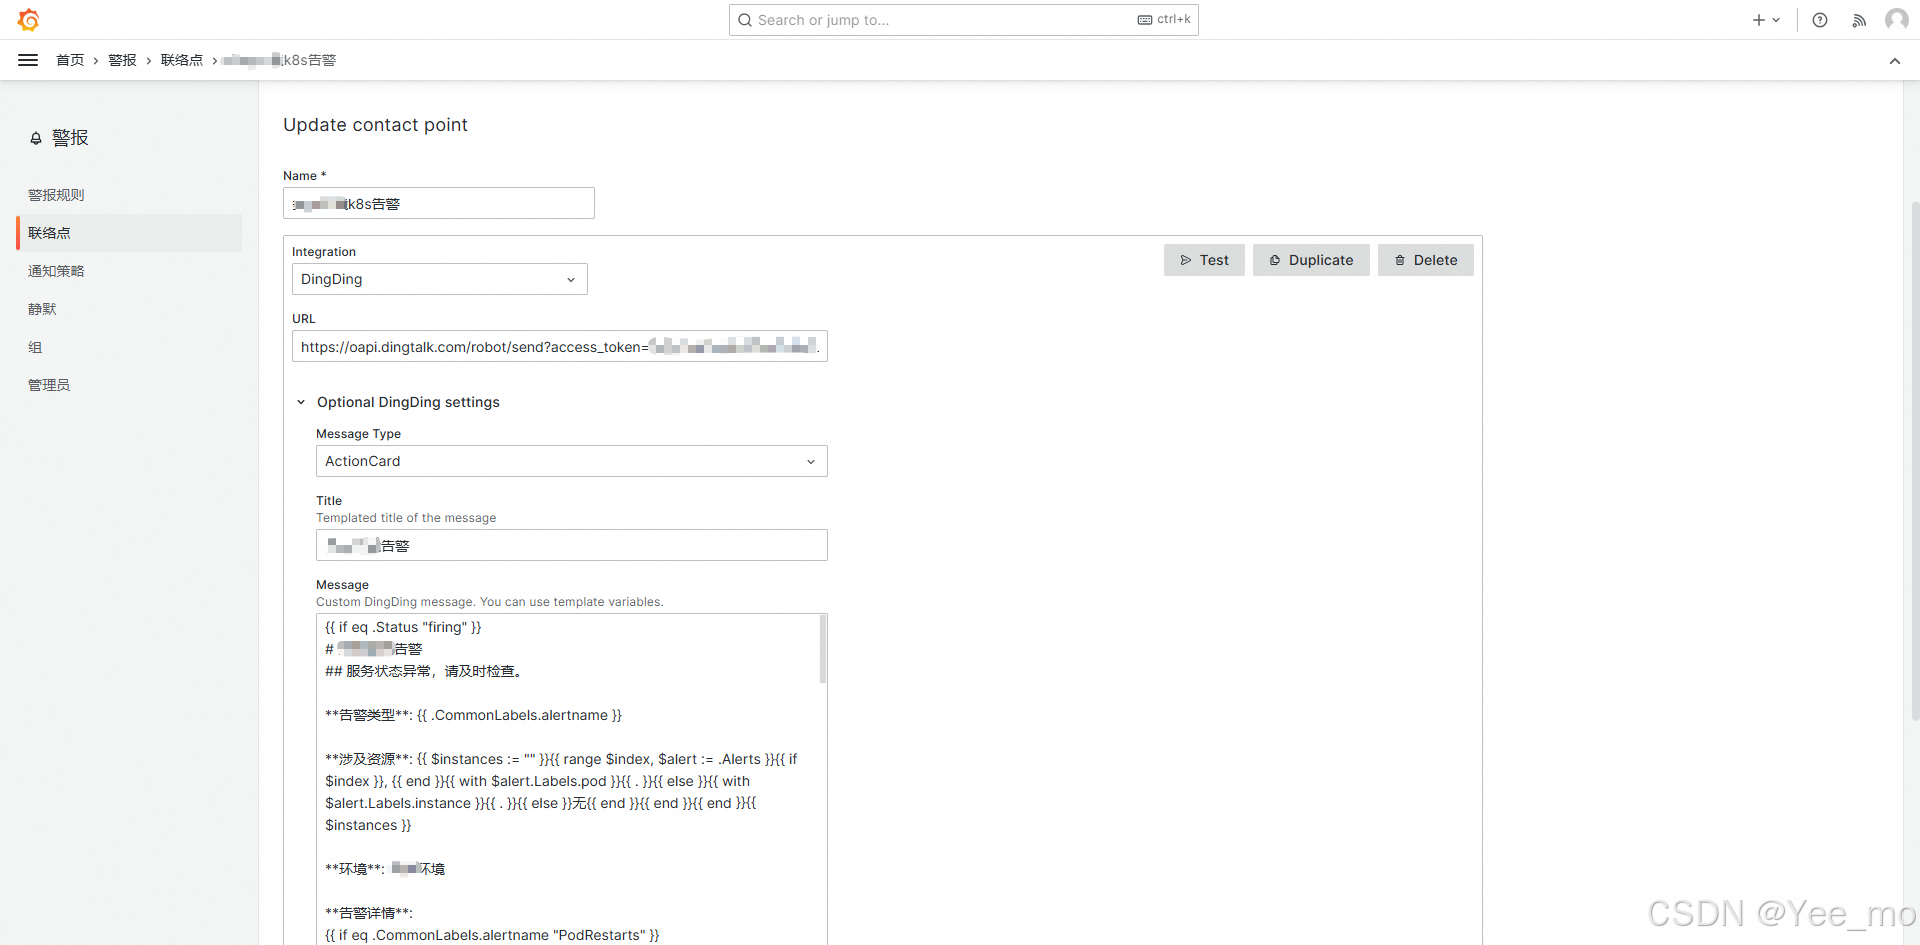
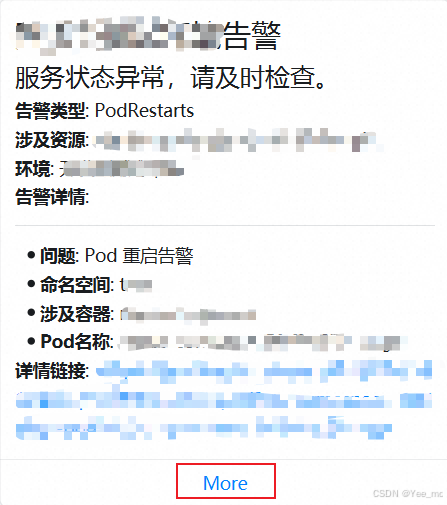
2.钉钉的Action Card样式,将会在消息底部自带一个”More“链接跳转到AlertList,无法修改,为官方bug:https://github.com/grafana/grafana/issues/98469
3.在配置通知策略时,要基于已有的规则去设定,否则无法生效,比如以下的示例,要先在第一条策略内配置”!=”放行你的通知,然后再添加策略”=“,指定对应的告警规则和联络点,这样告警规则才能对应上联络点。如果是刚搭建的监控,直接配置默认告警即可。

告警规则
k8s告警
PodRestarts
Pod 重启告警
Pod_Restart_Count_P
max(kube_pod_container_status_restarts_total{pod=~".*",container!="",container!="POD"}) by (namespace,container,pod)Pod_Restart_Count_N
max(kube_pod_container_status_restarts_total{pod=~".*",container!="",container!="POD"}) by (namespace,container,pod)($newRestartCount - $oldRestartCount) > 0
PodCPUUsage
Pod CPU 使用率超80%告警
max(irate(container_cpu_usage_seconds_total{pod=~".*",container!="",container!="POD",namespace=~"default"}[1m])) by (container,namespace,pod) / max(container_spec_cpu_quota{pod=~".*",container!="",container!="POD",namespace=~"default"}/100000) by (container,namespace,pod) or on() vector(0)PodMemoryUsage
Pod 内存 使用率超80%告警
sum( irate(container_memory_usage_bytes{pod=~".*", container!="", container!="POD"}[1m])) by (container, namespace, pod)/sum( container_spec_memory_limit_bytes{pod=~".*", container!="", container!="POD"}) by (container, namespace, pod)or on() vector(0)NodeCPUUsage
Node CPU使用率超80%告警
(1 - avg(rate(node_cpu_seconds_total{mode="idle"}[5m])) by (instance))* on(instance) group_left(nodename) (node_uname_info{nodename=~".+"})NodeMemoryUsage
Node Memory使用率超80%告警
(1 - (node_memory_MemAvailable_bytes / node_memory_MemTotal_bytes))* on(instance) group_left(nodename)node_uname_infoPodEvicted
Pod 被驱逐告警
sum(kube_pod_status_phase{phase="Evicted"})by (namespace,pod)PodOom
Pod OOM告警
sum by (namespace,pod) ((kube_pod_container_status_restarts_total{} - kube_pod_container_status_restarts_total{} offset 10m >= 1) and ignoring (reason) min_over_time(kube_pod_container_status_last_terminated_reason{reason='OOMKilled'}[10m]) == 1)ES告警
ESDiskUsage
ES 磁盘使用率超过70%
1-(elasticsearch_filesystem_data_available_bytes{job="elasticsearch-exporter-metrics",instance=~"elasticsearch-exporter.devops:9114",cluster="elasticsearch",name=~"(elasticsearch-client-0|elasticsearch-client-1|elasticsearch-data-0|elasticsearch-data-1|elasticsearch-data-2|elasticsearch-master-0|elasticsearch-master-1|elasticsearch-master-2)"}/elasticsearch_filesystem_data_size_bytes{job="elasticsearch-exporter-metrics",instance=~"elasticsearch-exporter.devops:9114",cluster="elasticsearch",name=~"(elasticsearch-client-0|elasticsearch-client-1|elasticsearch-data-0|elasticsearch-data-1|elasticsearch-data-2|elasticsearch-master-0|elasticsearch-master-1|elasticsearch-master-2)"})ESJVMUsage
ES JVM使用率超过85%
elasticsearch_jvm_memory_used_bytes{job="elasticsearch-exporter-metrics",instance=~"elasticsearch-exporter.devops:9114",cluster="elasticsearch",name=~"(elasticsearch-client-0|elasticsearch-client-1|elasticsearch-data-0|elasticsearch-data-1|elasticsearch-data-2|elasticsearch-master-0|elasticsearch-master-1|elasticsearch-master-2)"} / elasticsearch_jvm_memory_max_bytes{job="elasticsearch-exporter-metrics",instance=~"elasticsearch-exporter.devops:9114",cluster="elasticsearch",name=~"(elasticsearch-client-0|elasticsearch-client-1|elasticsearch-data-0|elasticsearch-data-1|elasticsearch-data-2|elasticsearch-master-0|elasticsearch-master-1|elasticsearch-master-2)"}ESCPUUsage
ES CPU使用率超过80%告警
elasticsearch_process_cpu_percent{job="elasticsearch-exporter-metrics",instance=~"elasticsearch-exporter.devops:9114",cluster="elasticsearch",name=~"(elasticsearch-client-0|elasticsearch-client-1|elasticsearch-data-0|elasticsearch-data-1|elasticsearch-data-2|elasticsearch-master-0|elasticsearch-master-1|elasticsearch-master-2)"}ESStatus
Elasticsearch集群健康状态异常
elasticsearch_cluster_health_status{color="red"}==1 or (elasticsearch_cluster_health_status{color="green"}==1)+4 or (elasticsearch_cluster_health_status{color="yellow"}==1)+22集群写入QPS(Count/s)
集群每秒钟写入的文档数量
rate(elasticsearch_indices_indexing_index_total{name!~"elasticsearch-client-0|elasticsearch-client-1|elasticsearch-master-0|elasticsearch-master-1|elasticsearch-master-2"}[1m])联络点
k8s
{{ if eq .Status "firing" }}
# k8s环境告警
## 服务状态异常,请及时检查。**告警类型**: {{ .CommonLabels.alertname }}**涉及资源**: {{ $instances := "" }}{{ range $index, $alert := .Alerts }}{{ if $index }}, {{ end }}{{ with $alert.Labels.pod }}{{ . }}{{ else }}{{ with $alert.Labels.instance }}{{ . }}{{ else }}无{{ end }}{{ end }}{{ end }}{{ $instances }}**环境**: k8s环境**告警详情**:
{{ if eq .CommonLabels.alertname "PodRestarts" }}
{{ range .Alerts }}
---
- **问题**: {{ .Annotations.description }}
- **命名空间**: {{ .Labels.namespace }}
- **涉及容器**: {{ .Labels.container }}
- **Pod名称**: {{ .Labels.pod }}**详情链接**: https://grafana.xxx.com/d/kubernetes?var-namespace={{ .Labels.namespace }}&var-pod={{ .Labels.pod }}
{{ end }}{{ else if eq .CommonLabels.alertname "PodCPUUsage" }}
{{ range .Alerts }}
---
- **问题**: {{ .Annotations.description }}
- **命名空间**: {{ .Labels.namespace }}
- **涉及容器**: {{ .Labels.container }}
- **Pod名称**: {{ .Labels.pod }}**详情链接**: https://grafana.xxx.com/d/kubernetes?var-namespace={{ .Labels.namespace }}&var-pod={{ .Labels.pod }}
{{ end }}{{ else if eq .CommonLabels.alertname "PodMemoryUsage" }}
{{ range .Alerts }}
---
- **问题**: {{ .Annotations.description }}
- **命名空间**: {{ .Labels.namespace }}
- **涉及容器**: {{ .Labels.container }}
- **Pod名称**: {{ .Labels.pod }}**详情链接**: https://grafana.xxx.com/d/kubernetes?var-namespace={{ .Labels.namespace }}&var-pod={{ .Labels.pod }}
{{ end }}{{ else if eq .CommonLabels.alertname "NodeCPUUsage" }}
{{ range .Alerts }}
---
- **问题**: {{ .Annotations.description }}
- **涉及实例**: {{ .Labels.instance }}
- **Node名称**: {{ .Labels.nodename }}**详情链接**:  https://grafana.xxx.com/d/kubernetes?var-node={{ .Labels.nodename }}
{{ end }}{{ else if eq .CommonLabels.alertname "NodeMemoryUsage" }}
{{ range .Alerts }}
---
- **问题**: {{ .Annotations.description }}
- **涉及实例**: {{ .Labels.instance }}
- **Node名称**: {{ .Labels.nodename }}**详情链接**:  https://grafana.xxx.com/d/kubernetes?var-node={{ .Labels.nodename }}
{{ end }}{{ else if eq .CommonLabels.alertname "PodEvicted" }}
{{ range .Alerts }}
---
- **问题**: {{ .Annotations.description }}
- **命名空间**: {{ .Labels.namespace }}
- **涉及容器**: {{ .Labels.container }}
- **Pod名称**: {{ .Labels.pod }}**详情链接**: https://grafana.xxx.com/d/kubernetes?var-namespace={{ .Labels.namespace }}&var-pod={{ .Labels.pod }}
{{ end }}{{ else if eq .CommonLabels.alertname "PodOom" }}
{{ range .Alerts }}
---
- **问题**: {{ .Annotations.description }}
- **命名空间**: {{ .Labels.namespace }}
- **涉及容器**: {{ .Labels.container }}
- **Pod名称**: {{ .Labels.pod }}**详情链接**: https://grafana.xxx.com/d/kubernetes?var-namespace={{ .Labels.namespace }}&var-pod={{ .Labels.pod }}
{{ end }}{{ else }}
- **问题**: 其他异常
{{ end }}{{ else if eq .Status "resolved" }}
# k8s环境恢复
### 服务已恢复至正常状态。**涉及资源**: {{ $instances := "" }}{{ range $index, $alert := .Alerts }}{{ if $index }}, {{ end }}{{ with $alert.Labels.pod }}{{ . }}{{ else }}{{ with $alert.Labels.instance }}{{ . }}{{ else }}无{{ end }}{{ end }}{{ end }}{{ $instances }}**环境**: k8s环境**告警类型**: {{ .CommonLabels.alertname }}{{ if .CommonAnnotations.summary }}{{ if ne .CommonAnnotations.summary ""}}
**总结**: {{ .CommonAnnotations.summary }}
{{ end }}{{ end }}{{ end }}
ES
{{ if eq .Status "firing" }}
# ES环境告警
## 服务状态异常,请及时检查。**告警类型**: {{ .CommonLabels.alertname }}**环境**: ES环境**告警详情**:
{{ if eq .CommonLabels.alertname "ESDiskUsage" }}
- **问题**: {{ .CommonAnnotations.description }}**详情链接**:  https://grafana.xxx.com/d/elasticsearch-exporter-quickstart-and-dashboard?orgId=1&viewPanel=32
{{ else if eq .CommonLabels.alertname "ESJVMUsage" }}
- **问题**: {{ .CommonAnnotations.description }}**详情链接**:  https://grafana.xxx.com/d/elasticsearch-exporter-quickstart-and-dashboard?orgId=1
{{ else if eq .CommonLabels.alertname "ESCPUUsage" }}
- **问题**: {{ .CommonAnnotations.description }}**详情链接**:  https://grafana.xxx.com/d/elasticsearch-exporter-quickstart-and-dashboard?orgId=1&viewPanel=88
{{ else if eq .CommonLabels.alertname "ESStatusY" }}
- **问题**: ES 健康状态异常—{{ $instances := "" }}{{ range $index, $alert := .Alerts }}{{ if $index }}, {{ end }}{{ $alert.Labels.color}}{{ end }}{{ $instances }}**详情链接**:  https://grafana.xxx.com/d/elasticsearch-exporter-quickstart-and-dashboard?orgId=1{{ else if eq .CommonLabels.alertname "ESStatusR" }}
- **问题**: ES 健康状态异常—{{ $instances := "" }}{{ range $index, $alert := .Alerts }}{{ if $index }}, {{ end }}{{ $alert.Labels.color}}{{ end }}{{ $instances }}**详情链接**:  https://grafana.xxx.com/d/elasticsearch-exporter-quickstart-and-dashboard?orgId=1{{ else }}
- **问题**: 其他异常**详情链接**:  https://grafana.xxx.com/d/elasticsearch-exporter-quickstart-and-dashboard?orgId=1
{{ end }}{{ else if eq .Status "resolved" }}
# ES环境恢复
### 服务已恢复至正常状态。**环境**: ES环境**告警类型**: {{ .CommonLabels.alertname }}{{ if .CommonAnnotations.summary }}{{ if ne .CommonAnnotations.summary ""}}
**总结**: {{ .CommonAnnotations.summary }}
{{ end }}{{ end }}{{ end }}