下载地址:https://grafana.com/grafana/download
[root@localhost ~]# wget https://dl.grafana.com/oss/release/grafana-7.2.0-
1.x86_64.rpm
安装
[root@localhost ~]# yum install grafana-7.2.0-1.x86_64.rpm -y
启动服务
[root@localhost ~]# systemctl enable --now grafana-server
[root@localhost ~]# ss -lnupt | grep 3000
tcp    LISTEN     0      128      :::3000                 :::*                   users:(("grafana-server",pid=1412,fd=8))
使用grafana-cli 安装插件
# grafana-cli plugins list-remote 列出所有可用的插件
# grafana-cli plugins install grafana-worldmap-panel 安装世界地图插件
# grafana-cli plugins install grafana-clock-panel 安装时间插件
# grafana-cli plugins install grafana-piechart-panel 安装圆饼插件
# grafana-cli plugins ls 列出已经安装的插件
安装完毕需要重启服务
# systemctl restart grafana-server
在浏览器输入URL IP:3000 用户名admin 密码admin

添加数据源
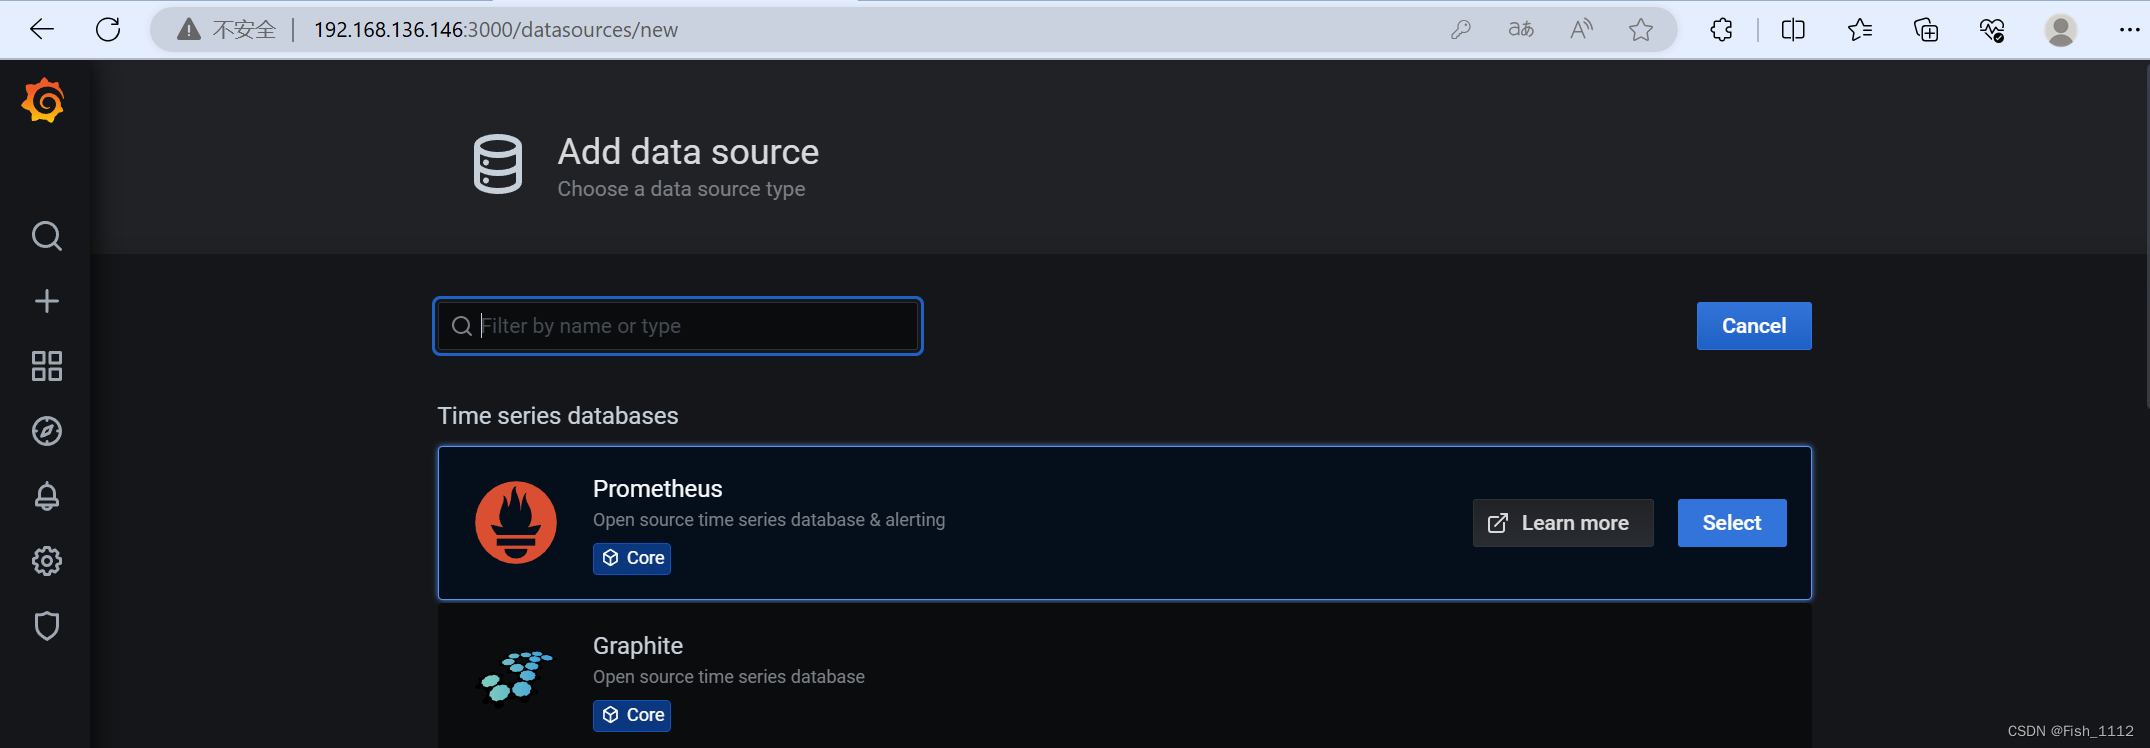 写Prometheus的IP
添加MySQL监控数据图形
此处我们使用MySQL Overview 监控的dashboard,dashboard Id为:7362


编号10547 node Exporter 0.16 + for Prometheus监控展示看板
