prometheus之钉钉报警
- 前言
- 1. 添加prometheus报警规则
- 1.2 添加自定义报警规则文件
- 2. 配置钉钉报警
- 2.2 部署dingding插件
- 3. 编写alertmanager配置文件
前言
在kubenetes上安装了kube-promethues(包含Prometheus Operator),程序正常跑起来了,主要是不知道如何配置规则文件和配置接收消息的对象。
1. 添加prometheus报警规则
kubectl get Prometheus -n 指定的命名空间(即Prometheus Operator安装的命名空间)
root@master2:~/dingtalk# kubectl get prometheus -n monitoring
NAME   VERSION   DESIRED   READY   RECONCILED   AVAILABLE   AGE
k8s    2.52.0    2         2       True         True        23h
查看详细内容
root@master2:~/dingtalk# kubectl get prometheus -n monitoring k8s -oyaml
...ruleNamespaceSelector: {}ruleSelector:matchLabels:prometheus: k8srole: alert-rulesscrapeConfigNamespaceSelector: {}scrapeConfigSelector: {}...
里面有个重要的内容,即matchLables,所有规则文件都需要有"prometheus:k8s"和"role:alert-rules",这样operator才会发现并自动创建。 非常重要
1.2 添加自定义报警规则文件
vim bm-custom-rules.yaml
内容如下,需要注意label:
apiVersion: monitoring.coreos.com/v1
kind: PrometheusRule
metadata:labels:Prometheus: k8sRole: alert-rulesname: prometheus-k8s-rules-wzqnamespace: monitoring
spec:groups: - name: 主机状态-监控告警rules:- alert: 节点内存expr: (1 - (node_memory_MemAvailable_bytes / (node_memory_MemTotal_bytes)))* 100 > 85for: 1mlabels:severity: warningannotations:summary: "内存使用率过高!"description: "节点{{$labels.instance}} 内存使用大于85%(目前使用:{{$value}}%)"- alert: 节点TCP会话expr: node_netstat_Tcp_CurrEstab > 1000for: 1mlabels:severity: warningannotations:summary: "TCP_ESTABLISHED过高!"description: "{{$labels.instance }} TCP_ESTABLISHED大于1000%(目前使用:{{$value}}%)"- alert: 节点磁盘容量expr: max((node_filesystem_size_bytes{fstype=~"ext.?|xfs"}-node_filesystem_free_bytes{fstype=~"ext.?|xfs"}) *100/(node_filesystem_avail_bytes {fstype=~"ext.?|xfs"}+(node_filesystem_size_bytes{fstype=~"ext.?|xfs"}-node_filesystem_free_bytes{fstype=~"ext.?|xfs"})))by(instance) > 80for: 1mlabels:severity: warningannotations:summary: "节点磁盘分区使用率过高!"description: "{{$labels.instance }} 磁盘分区使用大于80%(目前使用:{{$value}}%)"- alert: 节点CPUexpr: (100 - (avg by (instance) (irate(node_cpu_seconds_total{job=~".*",mode="idle"}[5m])) * 100)) > 85for: 1mlabels:severity: warningannotations:summary: "节点CPU使用率过高!"description: "{{$labels.instance }} CPU使用率大于80%(目前使用:{{$value}}%)"- alert: 节点存活expr: up{job='node-exporter'} != 1for: 1mlabels:severity: warningannotations:summary: "该节点已宕机"description: "{{$labels.instance }} 机器以宕机(目前使用:{{$value}}%)"
保存,并使用命令创建:
kubectl create -f bm-custom-rules.yaml
创建成功后,使用命令查询是否创建成功:
kubectl get PrometheusRule -n monitoring
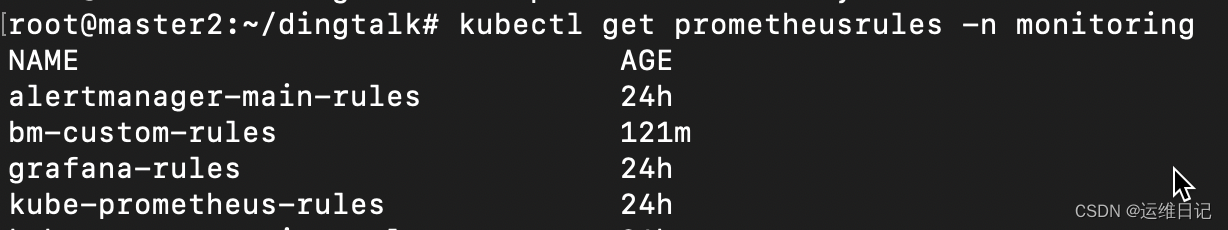
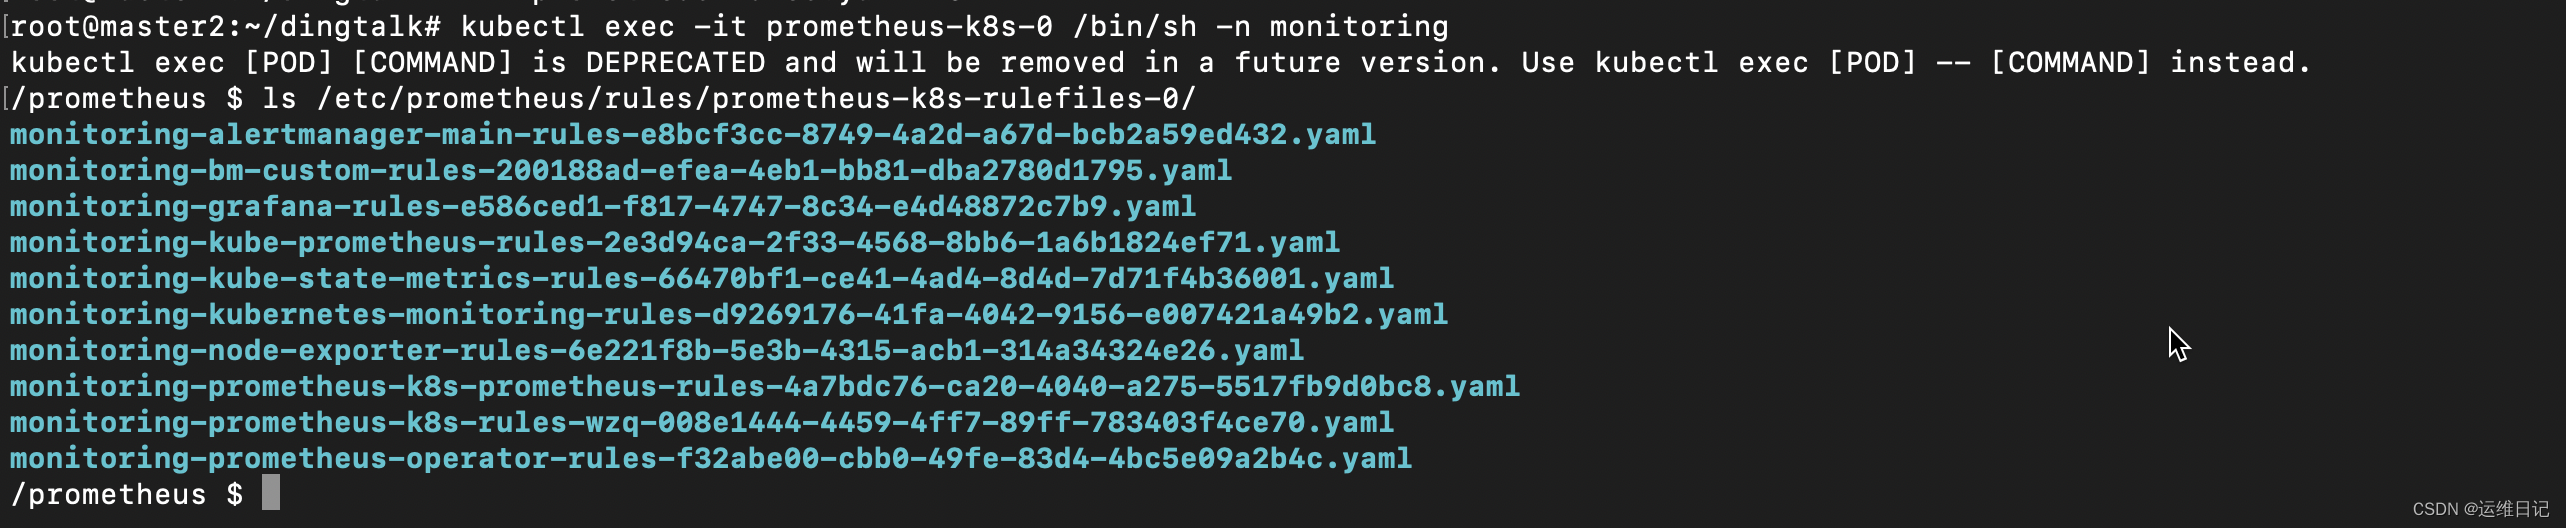
已经创建成功,进入容器查看
kubectl exec -it prometheus-k8s-0 /bin/sh -n 命名空间
cd /etc/prometheus/rules/prometheus-k8s-rulefiles-0/
ls
到这里 prometheus 的自定义规则部署完成,接下来准备接入钉钉并完成报警
2. 配置钉钉报警
首先在钉钉群里配置钉钉机器人 获取到token及secret
alertmanager 的 receive 并不直接支持钉钉的 url,要部署插件容器 prometheus-webhook-dingtalk
并且有个需要注意的地方是,当 receives 为钉钉时 (webhook_configs),它的告警模板不是在 alertmanager 的配置文件中指定的,而是在钉钉插件 prometheus-webhook-dingtalk 中指定的。
编写 prometheus-webhook-dingtalk 配置文件和模板
vim dingtalk-configmap.yaml,这里记的替换你的钉钉 url token。
apiVersion: v1
kind: ConfigMap
metadata:name: prometheus-webhook-dingtalk-confignamespace: monitoring
data:config.yml: |-templates:- /etc/prometheus-webhook-dingtalk/default.tmpltargets:webhook1:url: https://oapi.dingtalk.com/robot/send?access_token=1f315a3d3b68ae9a5df0f6cde411902c493a10bc3d6ed6bbba8cd8b4bcd1c848secret: SEC4d160d1d987b58a19e9a825b83715b253d0b6d0c255b5abb28c265798c535b7emessage:text: '{{ template "default.tmpl" . }}'default.tmpl: |{{ define "default.tmpl" }}{{- if gt (len .Alerts.Firing) 0 -}}{{- range $index, $alert := .Alerts -}}============ = **<font color='#FF0000'>告警</font>** = =============  **告警名称:**    {{ $alert.Labels.alertname }}   **告警级别:**    {{ $alert.Labels.severity }} 级   **告警状态:**    {{ .Status }}   **告警实例:**    {{ $alert.Labels.instance }} {{ $alert.Labels.device }}   **告警概要:**    {{ .Annotations.summary }}   **告警详情:**    {{ $alert.Annotations.message }}{{ $alert.Annotations.description}}   **故障时间:**    {{ ($alert.StartsAt.Add 28800e9).Format "2006-01-02 15:04:05" }}  ============ = end = =============  {{- end }}{{- end }}{{- if gt (len .Alerts.Resolved) 0 -}}{{- range $index, $alert := .Alerts -}}============ = <font color='#00FF00'>恢复</font> = =============   **告警实例:**    {{ .Labels.instance }}   **告警名称:**    {{ .Labels.alertname }}  **告警级别:**    {{ $alert.Labels.severity }} 级   **告警状态:**    {{   .Status }} **告警概要:**    {{ $alert.Annotations.summary }}  **告警详情:**    {{ $alert.Annotations.message }}{{ $alert.Annotations.description}}  **故障时间:**    {{ ($alert.StartsAt.Add 28800e9).Format "2006-01-02 15:04:05" }}  **恢复时间:**    {{ ($alert.EndsAt.Add 28800e9).Format "2006-01-02 15:04:05" }}  ============ = **end** = ============={{- end }}{{- end }}{{- end }}
然后创建 configmap
kubectl apply -f dingtalk-configmap.yaml
2.2 部署dingding插件
不同版本的插件指定配置文件的参数也不一样,这里部署的是 v2.1.0
vim dingtalk-webhook-deploy.yaml,这个文件不需要修改
apiVersion: v1
kind: Service
metadata:name: dingtalknamespace: monitoringlabels:app: dingtalk
spec:selector:app: dingtalkports:- name: dingtalkport: 8060protocol: TCPtargetPort: 8060---
apiVersion: apps/v1
kind: Deployment
metadata:name: dingtalknamespace: monitoring
spec:replicas: 2selector:matchLabels:app: dingtalktemplate:metadata:name: dingtalklabels:app: dingtalkspec:containers:- name: dingtalkimage: timonwong/prometheus-webhook-dingtalk:v2.1.0imagePullPolicy: IfNotPresentargs:- --web.listen-address=:8060- --config.file=/etc/prometheus-webhook-dingtalk/config.ymlports:- containerPort: 8060volumeMounts:- name: configmountPath: /etc/prometheus-webhook-dingtalkvolumes:- name: configconfigMap:name: prometheus-webhook-dingtalk-config
kubectl apply -f dingtalk-webhook-deploy.yaml
3. 编写alertmanager配置文件
此文件需要自己添加一条路由或用默认路由,和相应的接收者。
这里的接收者 webhook,其实是上面部署的钉钉插件 service 的地址
global:resolve_timeout: 1msmtp_smarthost: 'smtp.qq.com:25'smtp_from: '888888@qq.com'smtp_auth_username: '88888888@qq.com'smtp_auth_password: 'xxxxZXXX'smtp_require_tls: falseroute:group_by: ['alertname','job']group_wait: 30sgroup_interval: 10srepeat_interval: 30mreceiver: 'webhook'routes:- match:app: 'dingtalk'receiver: 'webhook'receivers:
- name: 'webhook'webhook_configs:# 和插件不同 namespace 请填写 http://webhook-dingtalk.monitoring.svc.cluster.local:8060/dingtalk/webhook1/send- url: 'http://dingtalk:8060/dingtalk/webhook1/send'send_resolved: true
先将之前的 secret 对象删除
kubectl delete secret alertmanager-main -n monitoring
secret "alertmanager-main" deleted
kubectl create secret generic alertmanager-main --from-file=alertmanager.yaml -n monitoring
secret "alertmanager-main" created
删除alertmanager 的pod
等待一段时间 然后查看alermanager容器的日志有无报错