文章目录
- Iris数据的准备
- 1.直接从sklearn.datasets 加载或转化成文件已备本地使用
- 2.可以在https://archive.ics.uci.edu/dataset/53/iris下载
- 过程
- 示例
- 代码如下
- 生成的决策树如下:
- 生成的分析报告如下:
- 决策树模型分析报告
- 1. 模型性能
- 2. 特征重要性
- 3. 决策规则
Iris数据的准备
1.直接从sklearn.datasets 加载或转化成文件已备本地使用
代码如下:
from sklearn.datasets import load_iris
import pandas as pd# 加载数据集
iris = load_iris()
df = pd.DataFrame(data=iris.data, columns=iris.feature_names)# 将数字标签替换为植物名
df['species'] = [iris.target_names[i] for i in iris.target]  # 新增一列植物名
df['target'] = iris.target
# # 保存为Excel文件(不包含行索引)
df.to_excel("iris_dataset.xlsx", index=False)
execl表格如下所示
| sepal length (cm) | sepal width (cm) | petal length (cm) | petal width (cm) | species | target |
|---|---|---|---|---|---|
| 5.1 | 3.5 | 1.4 | 0.2 | setosa | 0 |
| 4.9 | 3 | 1.4 | 0.2 | setosa | 0 |
| 4.7 | 3.2 | 1.3 | 0.2 | setosa | 0 |
2.可以在https://archive.ics.uci.edu/dataset/53/iris下载
过程
- 读取数据
- 确定特征
- 训练决策树模型(按重要性分裂)
- 模型评估
- 可视化决策树
- 生成决策树分析报告
示例
代码如下
import pandas as pd
import numpy as np# 读取数据
df_train = pd.read_excel('iris_dataset.xlsx')# print(df_train.keys())
# print(df_train.head())# 特征工程
def create_features(df):#初始化featuresfeatures = pd.DataFrame()#简化df中原来的列名(feature)features['SepalLength'] = df['sepal length (cm)']features['SepalWidth'] = df['sepal width (cm)']features['PetalLength'] = df['petal length (cm)']features['PetalWidth'] = df['petal width (cm)']return features
# 创建特征
features_train = create_features(df_train)
# print("features_train")
# define the X and y
X_train = df_train.drop(['species', 'target'], axis=1)
y_train = df_train.loc[:, 'target']
# print(X.head())
# print(y.head())
# print(X_train.shape, y_train.shape)
#
# 训练决策树模型(按重要性分裂)
from sklearn.tree import DecisionTreeClassifier,export_textdt = DecisionTreeClassifier(criterion='entropy',min_samples_leaf=5,splitter='best'  # 确保优先选重要性高的特征# ,max_features=1  # 每次分裂只考虑1个特征(需配合特征选择使用)
)
dt.fit(X_train, y_train)
feature_importance = pd.DataFrame({'feature': features_train.columns,'importance': dt.feature_importances_})
# print("特征重要性:\n", feature_importance)# 模型评估
from sklearn.metrics import accuracy_scorey_predict = dt.predict(X_train)
train_score = accuracy_score(y_train, y_predict)
print(train_score)# 可视化决策树
import matplotlib.pyplot as plt
from sklearn.tree import plot_tree# 设置中文显示
plt.rcParams['font.sans-serif'] = ['SimHei']
plt.rcParams['axes.unicode_minus'] = Falsefig = plt.figure(figsize=(10, 10))
#print(features_train.columns)
plot_tree(dt, feature_names=features_train.columns,class_names=['setosa', 'versicolor','virginica'],filled=True, rounded=True, fontsize=12)
#plt.show()
plt.savefig('decision_tree.png', dpi=300, bbox_inches='tight', pad_inches=0.5)# 生成决策树规则文本
tree_rules = export_text(dt, feature_names=list(features_train.columns))# 生成分析报告
with open('决策树分析.md', 'w', encoding='utf-8') as f:f.write('# 决策树模型分析报告\n\n')# 模型性能f.write('## 1. 模型性能\n')f.write(f'- 训练集准确率: {train_score:.4f}\n')# 特征重要性f.write('## 2. 特征重要性\n')feature_importance = pd.DataFrame({'feature': features_train.columns,'importance': dt.feature_importances_}).sort_values('importance', ascending=False)for _, row in feature_importance.iterrows():f.write(f'- {row["feature"]}: {row["importance"]:.4f}\n')# 决策规则f.write('\n## 3. 决策规则\n')f.write('```\n')f.write(tree_rules)f.write('\n```\n\n')
生成的决策树如下:
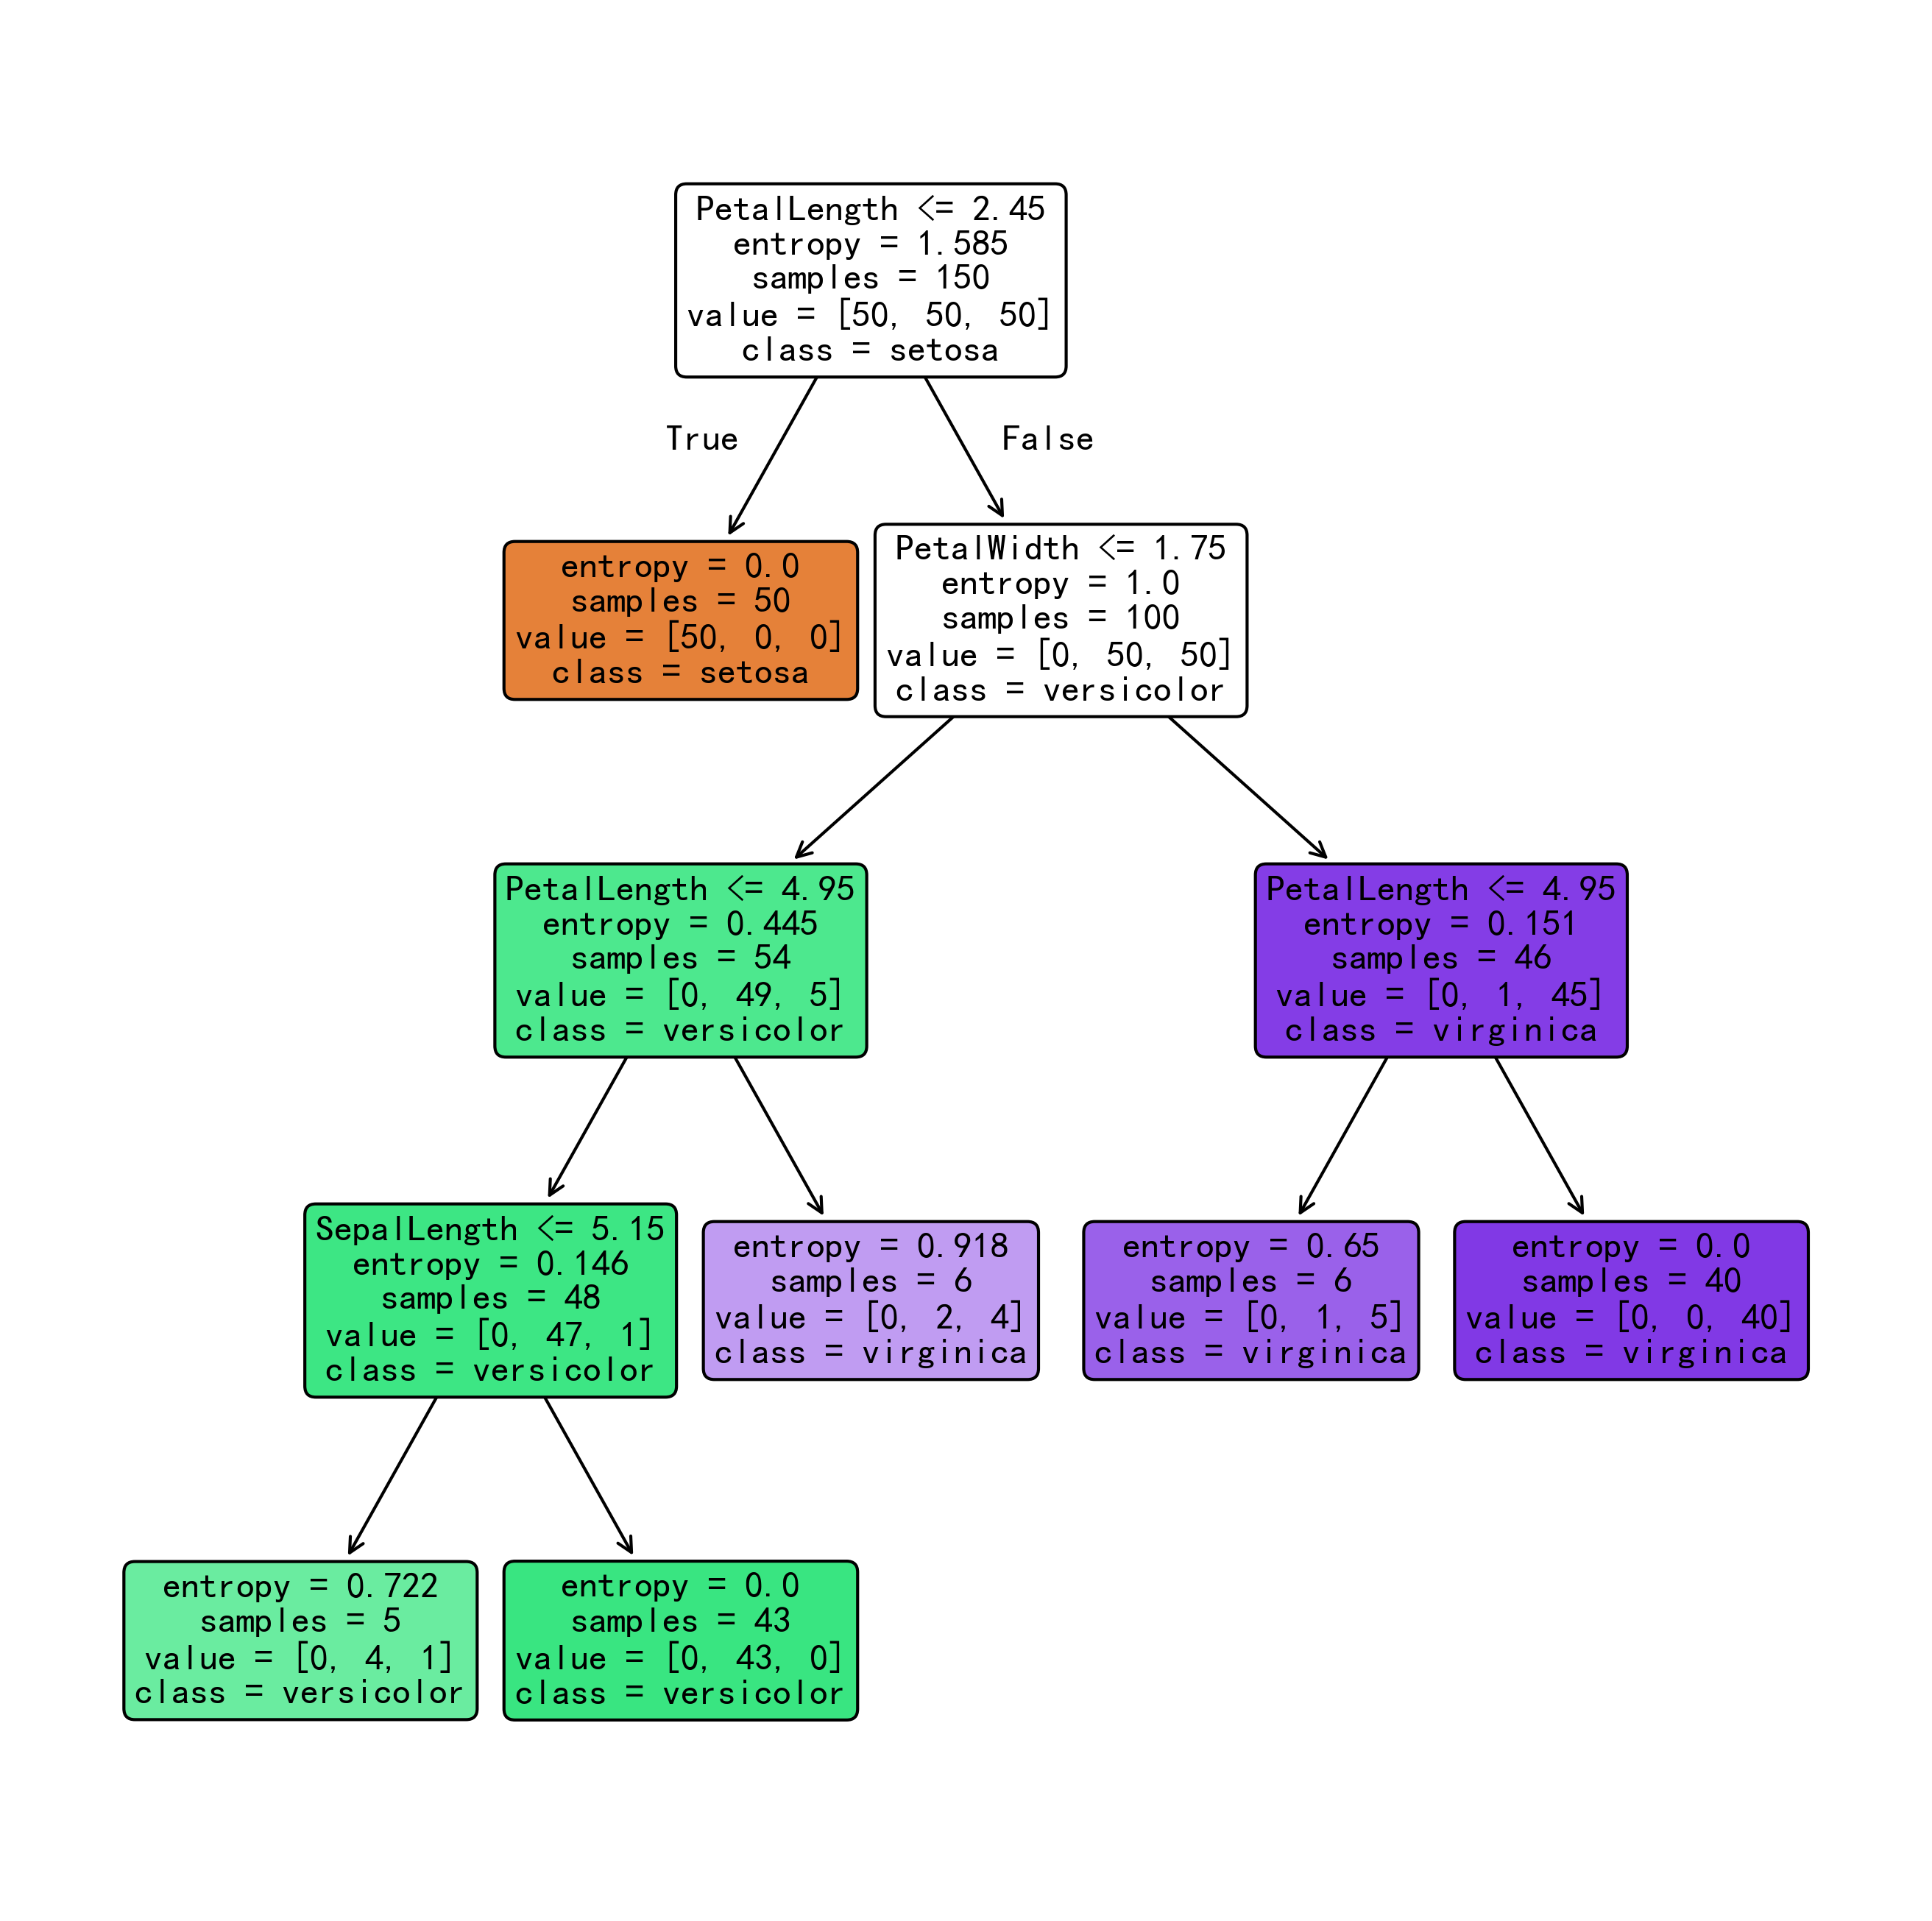
生成的分析报告如下:
决策树模型分析报告
1. 模型性能
- 训练集准确率: 0.9733
2. 特征重要性
- PetalLength: 0.6777
- PetalWidth: 0.3071
- SepalLength: 0.0151
- SepalWidth: 0.0000
3. 决策规则
|--- PetalLength <= 2.45
|   |--- class: 0
|--- PetalLength >  2.45
|   |--- PetalWidth <= 1.75
|   |   |--- PetalLength <= 4.95
|   |   |   |--- SepalLength <= 5.15
|   |   |   |   |--- class: 1
|   |   |   |--- SepalLength >  5.15
|   |   |   |   |--- class: 1
|   |   |--- PetalLength >  4.95
|   |   |   |--- class: 2
|   |--- PetalWidth >  1.75
|   |   |--- PetalLength <= 4.95
|   |   |   |--- class: 2
|   |   |--- PetalLength >  4.95
|   |   |   |--- class: 2